Direct answer
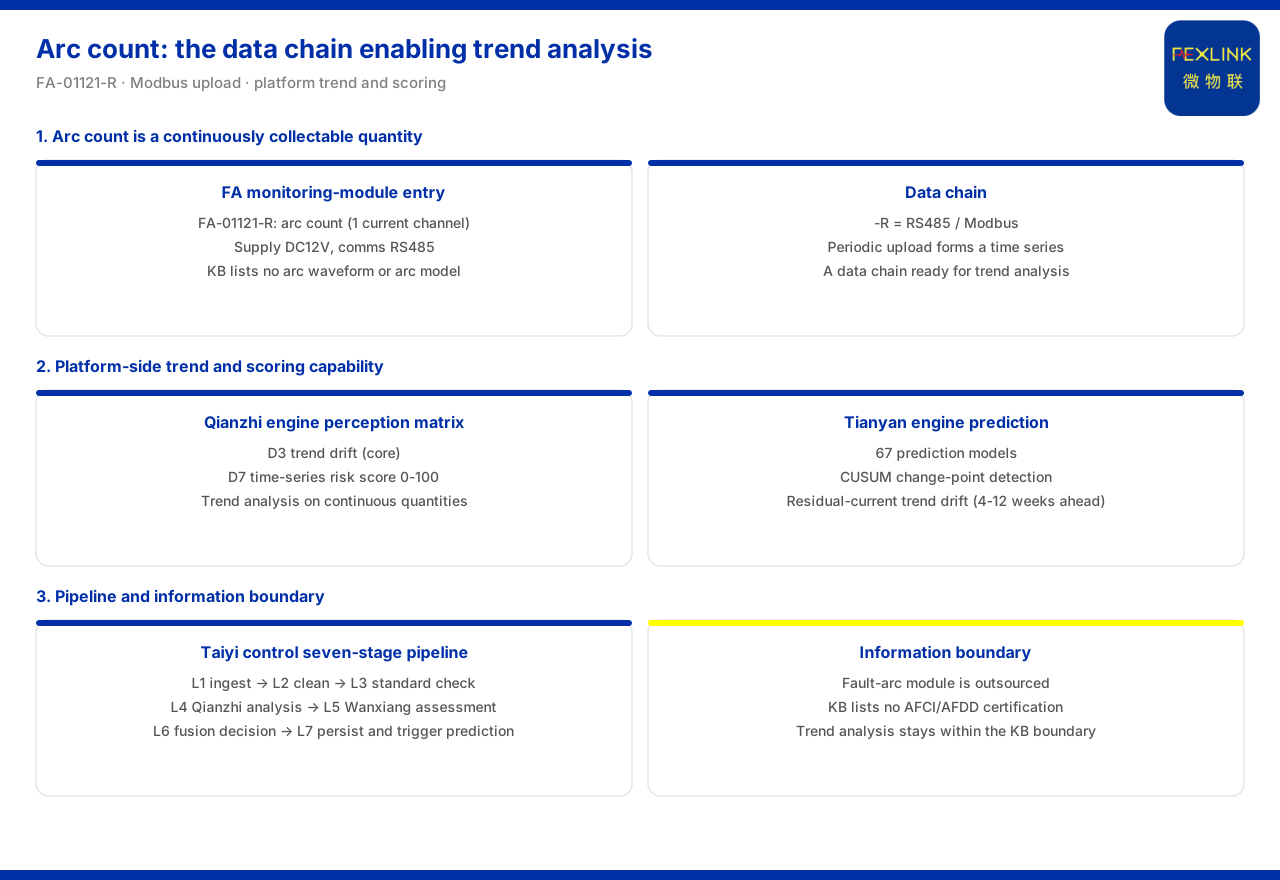
Arc count can be used for trend analysis, but the object and boundary of that analysis must be stated clearly. The product knowledge base specifies that the FA arc-fault monitoring module (e.g. FA-01121-R) has arc count as its monitoring function, with a single current channel as its acquisition object and DC12V supply and RS485 communication; because the -R suffix corresponds to RS485 and Modbus, arc count can be uploaded periodically by Modbus RTU and thus form a continuous series over time. On top of this, the platform capabilities given by the product knowledge base include a trend-drift dimension and a time-series risk-scoring dimension, and the prediction engine also possesses trend-prediction methods for monitored quantities. "Can do trend analysis" therefore means: arc count has a data link capable of forming a time series, and the platform has the capability to run trend and scoring on that series. At the same time, the product knowledge base does not list arc waveform or an arc model, nor any related certification, so trend analysis can only be stated within this boundary.
Arc count is a continuously acquirable quantity
The premise of trend analysis is a quantity that can be acquired repeatedly. The product knowledge base specifies that the FA arc-fault monitoring module FA-01121-R has arc count as its monitoring function, with a single current channel as its acquisition object, DC12V supply and RS485 communication. The product knowledge base does not list arc waveform or arc-model parameters, meaning that within the listed information arc count is the acquirable quantity the module provides. A count is a quantity that can be accumulated item by item or read by period, which provides the basis for later organising the data along the time axis.
The data link from arc count to a time series
Once there is an acquirable quantity, it must be read out stably. The general suffix rule in the product knowledge base specifies that -R denotes RS485 and Modbus, and FA-01121-R uses RS485 communication, so arc count can be uploaded periodically by Modbus RTU and has the data link to form a time series for trend analysis. The key here is not a single reading but "periodic upload": only when data keeps entering the system at a fixed rhythm can changes before and after be compared and trends identified. If arc count is merely sampled occasionally, the result is a static number that cannot indicate whether events are increasing or levelling off.
Two trend capabilities on the platform side
After the data enters the platform, corresponding analytical capability is needed to receive it. In the Qianzhi engine's perception matrix the product knowledge base includes a trend-drift dimension, marks it as a core dimension, and also includes a time-series risk-scoring dimension that outputs decision information as a composite score of 0 to 100. These two capabilities show that the platform side can both judge whether a quantity is slowly deviating from its baseline and synthesise multi-dimensional information into a comparable score. For arc count, trend drift answers "is the count quietly rising", while the time-series score answers "how much weight this rise carries in the composite judgement".
How the prediction engine treats trends
Beyond perception, the product knowledge base also describes the methodology of the Tianyan engine: it answers "what will happen and when to act" with a large number of prediction models and adopts algorithms such as change-point detection; one example model is residual-current trend drift, which can give an early warning several weeks ahead. The meaning of this example is to show the method path: for a continuously acquired quantity, change-point detection can first identify the onset of a trend, and a prediction model can then give a time window. Arc count is likewise a continuously acquired quantity and can follow this method path, provided the data link is complete and the time series continuous.
Where the seven-stage pipeline places trend analysis
The position of trend analysis in the system pipeline can also be determined. The product knowledge base describes that the processing pipeline of the Taiyi intelligent control hub system runs from ingestion and cleaning to standard validation, then to analysis and assessment, and then to fusion decision and persistence; the persistence stage includes dual-database storage and real-time push, and triggers the prediction engine. For arc count this means the data first passes through ingestion and cleaning, then enters analysis and assessment, and is finally stored at the persistence stage and triggers prediction. In other words, trend analysis is not a one-off offline action but is placed in a fixed stage after data enters the system. This arrangement also shows that as long as arc count keeps uploading it will naturally enter the trend-analysis flow, without building a separate analysis channel.
What can and cannot be done: the boundary
The boundary must be stated as well. The product knowledge base notes in its known information gaps that the arc-fault monitoring module in the production mode is outsourced; the full text lists no related certification or arc model. Trend analysis of arc count must therefore stay within the listed information boundary: it may state that the data can be uploaded periodically, that the platform has trend-drift and time-series scoring capability, and that the prediction engine has trend-prediction methods, but it must not infer waveform characteristics, arc-discrimination models or certification conclusions from this. Only with the boundary clear does the conclusion of trend analysis hold.
Checking sequence
Gathering the clues above into a sequence, four steps can be followed. First, confirm whether arc count can be uploaded at a fixed period, that is, whether the data link holds. Second, confirm whether the platform side has trend-drift and time-series scoring capability. Third, confirm whether the prediction engine has been connected to that data stream and whether the pipeline brings it into persistence and prediction triggering. Fourth, check whether any unlisted waveform, model or certification requirement exists; if so, mark it as a matter outside the information boundary. In this order, the answer is "under what conditions arc count can be used for trend analysis".
Applicability and limits
First, this article only restates content listed in the product knowledge base; its factual boundary is limited to the monitoring function and basic configuration of the FA arc-fault monitoring module, the correspondence between RS485 and Modbus, the general four-layer architecture and edge-layer consolidation, the trend-drift and time-series scoring dimensions of the perception matrix, the methodology and examples of the prediction engine, the stages of the processing pipeline, and the outsourced attribute and information gap of the arc-fault monitoring module, and it introduces no unlisted parameters, certifications or cases.
Second, the arc-count monitoring function, supply and communication of the FA arc-fault monitoring module are cited on the terms listed in the product knowledge base; this article does not infer unlisted waveform or model parameters from them.
Third, the correspondence between the general suffixes and Modbus is cited on the terms listed in the product knowledge base; this article draws no conclusion on the sampling period or reporting frequency of a specific project.
Fourth, the trend-drift and time-series scoring dimensions of the perception matrix, the methodology and example models of the prediction engine, and the stages of the processing pipeline are all cited on the terms listed in the product knowledge base.
Fifth, the arc-fault monitoring module being outsourced and the absence of listed related certification or arc model are known information boundaries in the product knowledge base; this article makes no inference about the waveform discrimination or certification status of such products.
Sixth, this article does not commit to any specific project's selection result or on-site performance, which remain subject to the latest product documentation and project scheme.