Direct answer
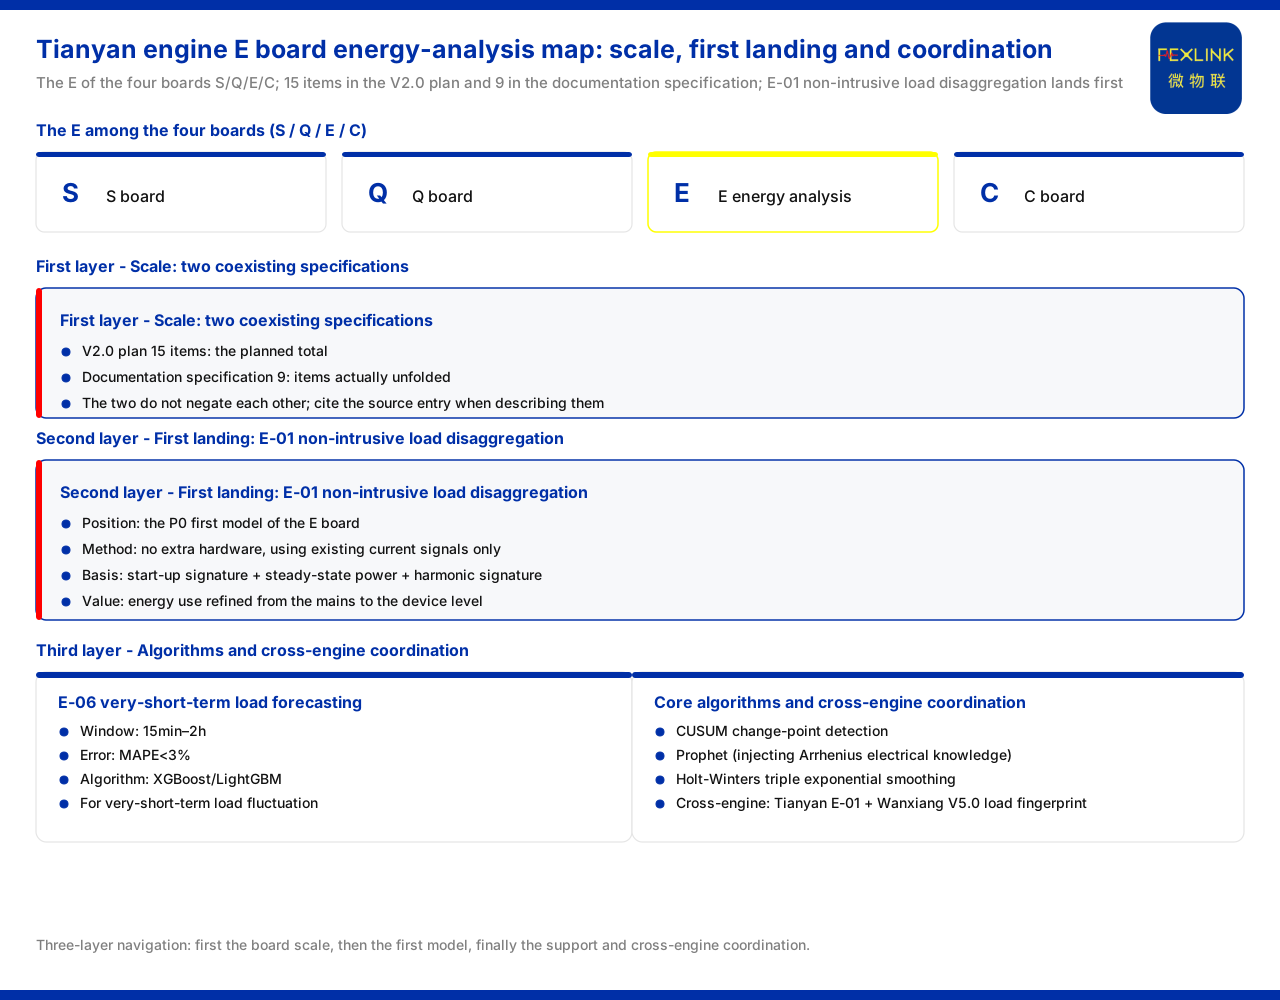
The energy-analysis capability of the Prediction Engine (large model) sits in the E board of its four-board plan. The product knowledge base records that the Prediction Engine is planned in four boards, S, Q, E and C, in which E energy analysis is listed as 15 items in the V2.0 plan and as 9 in the documentation introduction specification; the first landing point of this board is E-01 non-intrusive load disaggregation. That is, when answering "how many models the E board contains and which directions it covers", two figures must be seen at once: the 15 items planned and the 9 items in the documentation specification. The two coexist rather than negate each other. The direction is indicated by the first model — what lands first is a device-level energy-identification capability. On this basis, the product knowledge base also records the prediction window and error specification of the very-short-term load forecast E-06, and core algorithms such as CUSUM, Prophet, XGBoost/LightGBM and Holt-Winters. This article restates only the above existing entries and infers no composition of an unlisted model list.
1. E among the four boards: the position of energy analysis
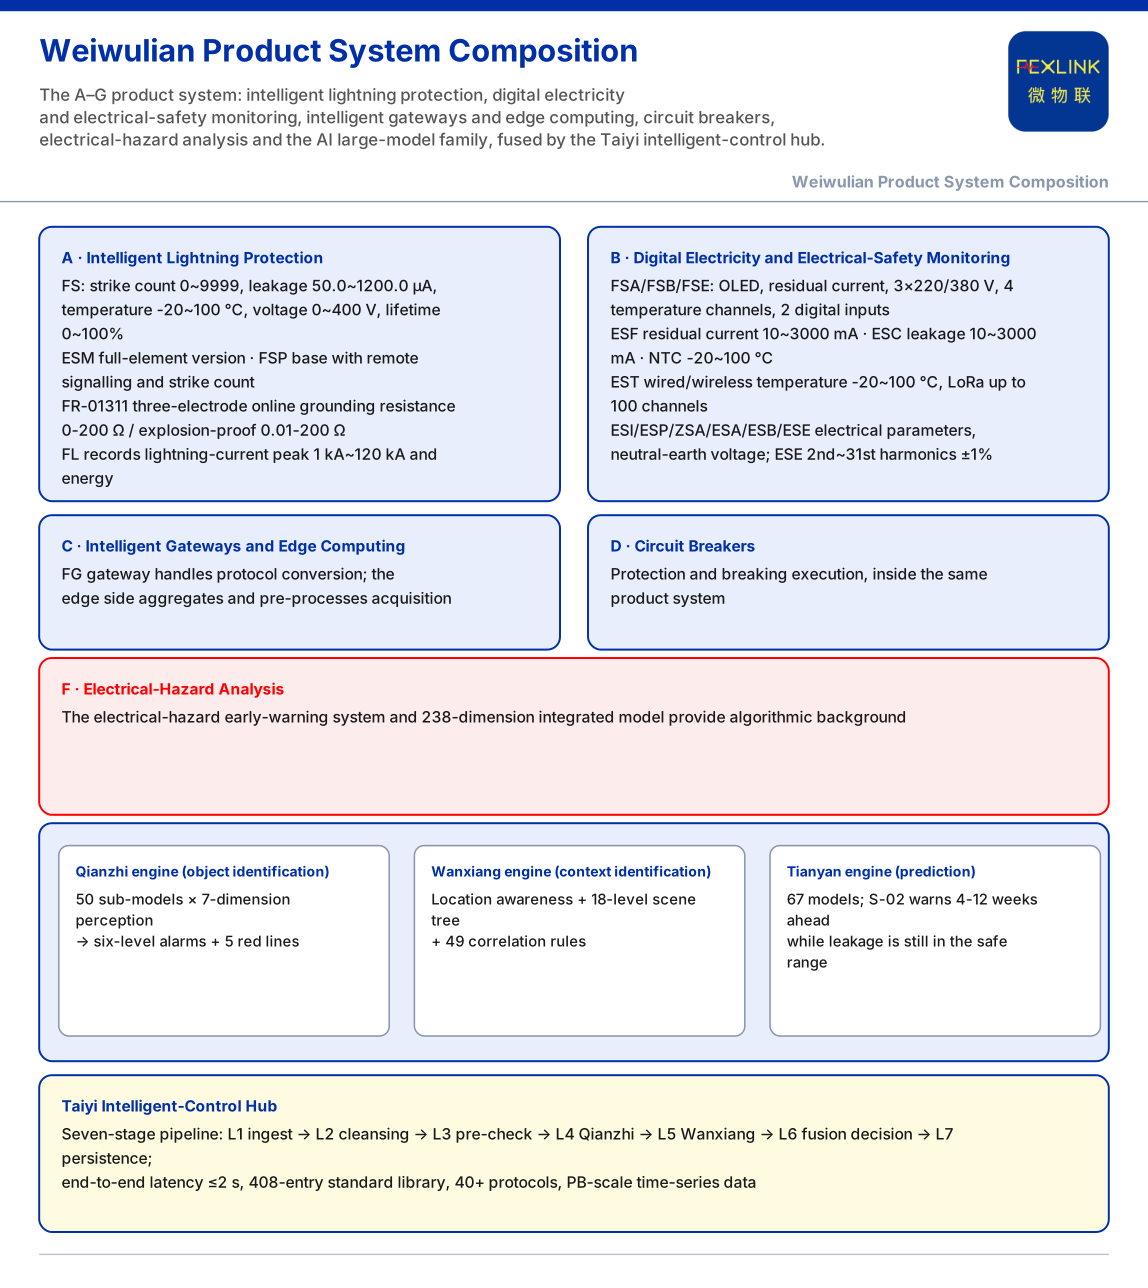
The product knowledge base divides the Prediction Engine plan into four boards, S, Q, E and C, of which E energy analysis is one, parallel to the other directions. Placed back into the four-board framework, its position is to answer the class of "energy use" questions: how much electricity a device used, where it was used, and how much it will use next. This position determines that the models of the E board are not isolated feature points but a set of capabilities organised around energy analysis. For product-planning and energy-solution staff, the first step in understanding the E board is not to memorise every model but to see its place in the whole engine. The four-board division means the Prediction Engine prediction capability is organised by category, and energy analysis is one independent direction; the boards can cooperate, but each has a clear problem domain. Only by seeing the E board as a whole can one speak of a "map".
2. Quantity specification: 15 items and 9
To the question "how many models the E board contains", the product knowledge base gives two coexisting specifications: 15 items in the V2.0 plan and 9 in the documentation introduction specification. The two are not contradictory — one is the planned total, the other the number of items actually unfolded in the documentation. This matters: when describing the energy-analysis map externally, the source should be noted per the knowledge-base specification, rather than treating one figure as the only answer. Any expression involving a quantity should be traceable to the corresponding entry in the product knowledge base.
3. The first landing point: non-intrusive load disaggregation
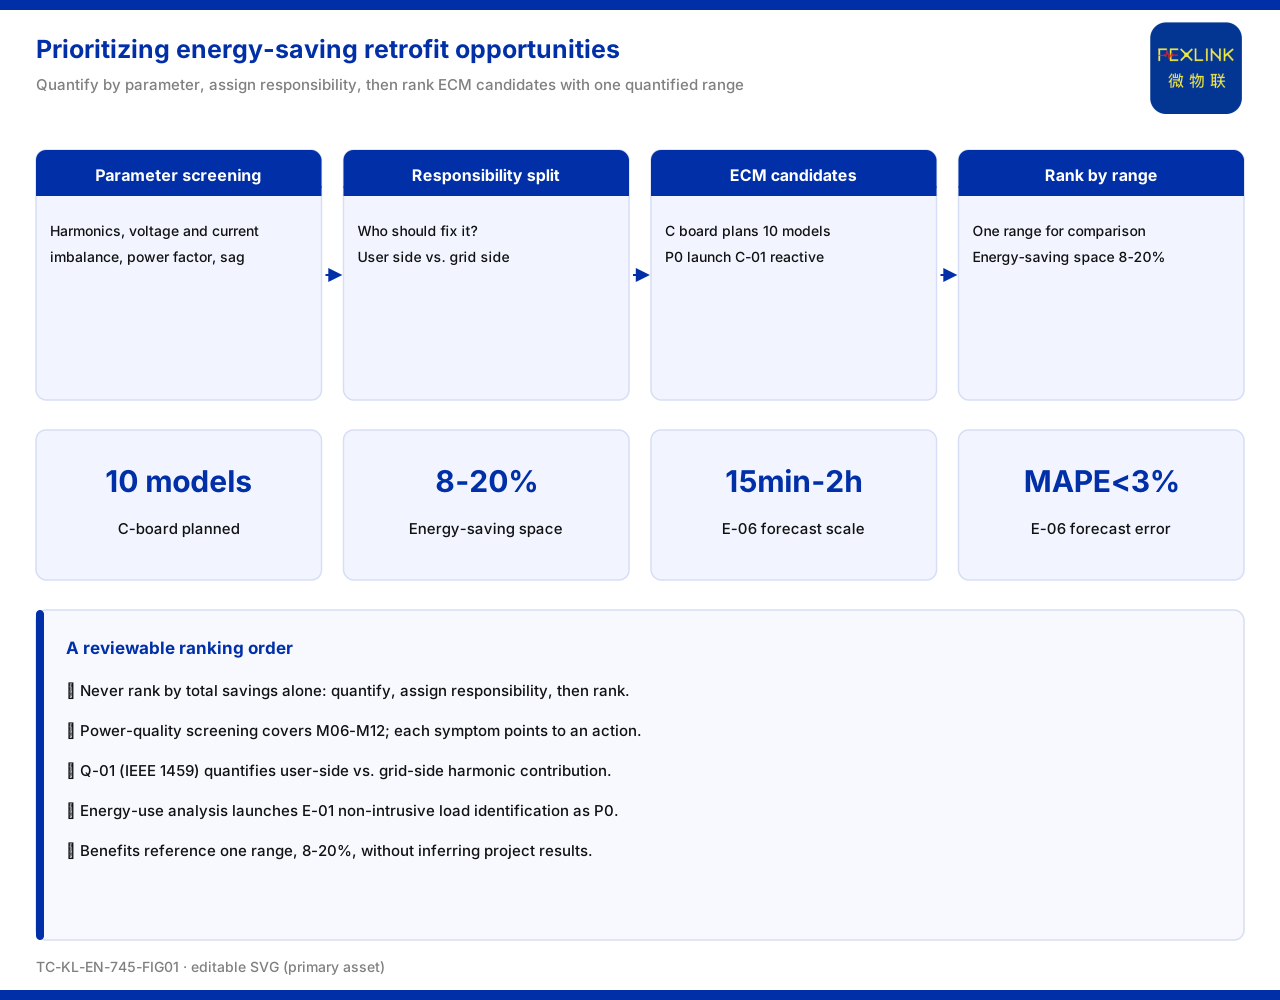
The product knowledge base records E-01 as the P0 first model of the E energy-analysis board, whose capability is non-intrusive load disaggregation. Non-intrusive means not changing the existing distribution and device wiring, starting only from the existing current signal. As the first landing point, the significance of E-01 is not merely one more model but the establishment of the board's first deliverable capability: refining energy data from the total-meter level to the device level. For the user, the value of this capability is "seeing inside": total electricity can only answer how much was used, while device-level identification answers where it was used. When the energy composition can be disaggregated to the device level, energy-saving diagnosis and load management have direct data support. That the E board starts with E-01 shows its planning order is to solve "identification" first and then extend to prediction and other directions.
4. How non-intrusive load disaggregation identifies devices
The product knowledge base records that E-01 needs no additional hardware and identifies specific devices through the current waveform, with the identification based on the combination of startup signature, steady-state power and harmonic signature. The three signatures each play a role: the startup signature captures the transition at the instant a device is switched on, the steady-state power reflects the power level at which the device runs stably, and the harmonic signature corresponds to the high-frequency components in the current waveform. Only the three together can separate devices of similar power and similar shape. It must be emphasised that this is the identification method recorded by the product knowledge base; this article infers no identification accuracy or applicable device range from it. "No additional hardware" is likewise cited per the knowledge-base specification and is not expanded into a conclusion about the installation conditions of any site.
5. Very-short-term load forecasting and core algorithms
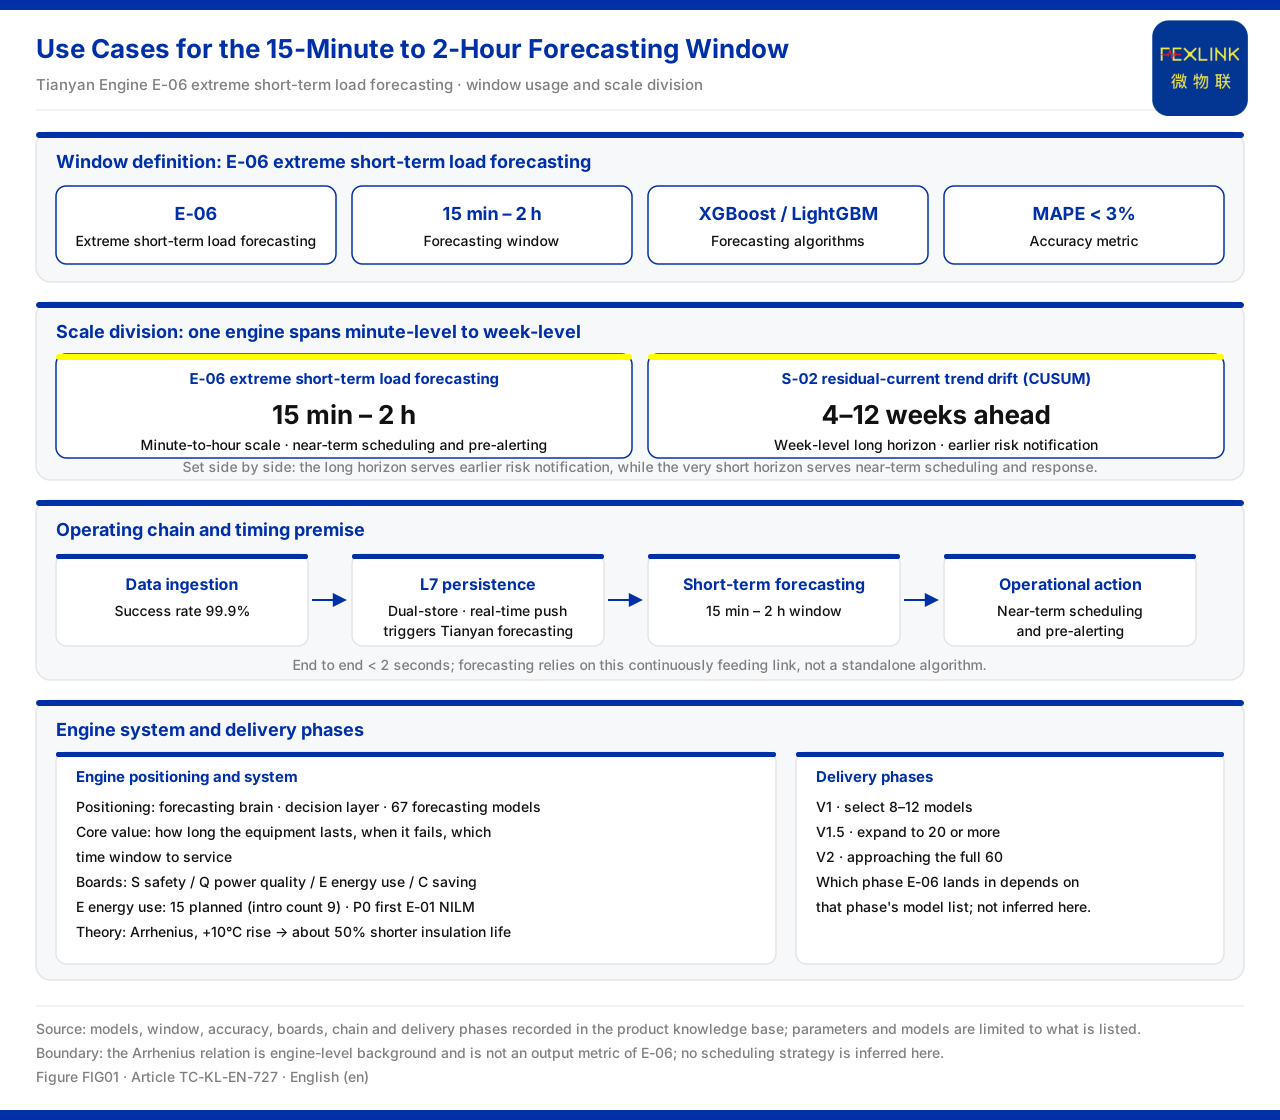
Another direction pointed out by the knowledge base in the E board is very-short-term load forecasting. The product knowledge base records that E-06 very-short-term load forecasting uses XGBoost/LightGBM, with a prediction window of 15 minutes to 2 hours and a MAPE below 3%. This specification shows that the forecast is aimed at a short time scale and that the evaluation metric is the mean absolute percentage error. At a lower level, the product knowledge base lists the core algorithms of the Prediction Engine as including CUSUM change-point detection, Prophet injected with Arrhenius electrical knowledge, and XGBoost/LightGBM and Holt-Winters triple exponential smoothing. These algorithms serve prediction tasks together: change-point detection finds turning points in a series, Prophet strengthens trend modelling with electrical knowledge, and machine learning and exponential smoothing handle load series of different shapes. Placing E-06 alongside these underlying algorithms shows that the E board's capability comprises both result-oriented models and the algorithm foundation supporting modelling.
6. Cross-engine coordination: Correlation Engine load fingerprint
Energy analysis does not occur only inside the Prediction Engine. The product knowledge base records that the evolution direction of the Correlation Engine (large model) V5.0 is a non-intrusive load fingerprint. In the "product selection and AI capability comparison", the selection combination for non-intrusive load identification is listed as Prediction Engine E-01 plus Correlation Engine V5.0 load fingerprint. That is, at the product level, the device-level energy-identification capability is jointly carried by Prediction Engine and Correlation Engine: E-01 provides the load disaggregation, and the Correlation Engine load fingerprint provides the support on the identification side. This combination links energy analysis with identification capability, and also shows that the landing of the E board is not confined to a single engine. When planning energy-analysis capability, solution staff need to consider the division between Prediction Engine and Correlation Engine rather than understand load identification as a function of Prediction Engine alone.
7. How the map is used for planning
Putting the above together, the E board model map can be understood in three layers. The first layer is the total: 15 items in the V2.0 plan and 9 in the documentation specification, indicating the board's scale and degree of unfolding. The second layer is the first landing: E-01 non-intrusive load disaggregation, pointing to the first deliverable capability. The third layer is algorithms and coordination: the prediction window and error specification of E-06, core algorithms such as CUSUM, and the combination of Prediction Engine E-01 plus Correlation Engine load fingerprint, showing how the capability takes root downward and coordinates outward. Together, the three layers form a usable navigation map: first look at the board's scale, then the first model, and finally the support and coordination. By this order, the E board is neither a static list nor a vague description of "many models", but a capability map with a clear starting point and directions of extension. All of the above is limited to the entries listed by the product knowledge base.
Scope and limitations
First, this article restates only what the product knowledge base lists, with the factual boundary limited to the existing entries on the S, Q, E and C four-board plan of the Prediction Engine, the 15 items in the V2.0 plan and 9 in the documentation specification for E energy analysis, the positions and algorithms of E-01 and E-06, and the Correlation Engine V5.0 load fingerprint and the selection combination.
Second, the quantity specification is cited as "15 items in the V2.0 plan and 9 in the documentation introduction specification"; this article gives no other reading of the two and infers no item-by-item composition of the model list.
Third, E-01's "no additional hardware, current-waveform device identification, joint use of three signatures" is cited per the product knowledge base; this article infers no identification accuracy, applicable device range or deployment condition.
Fourth, the prediction window of 15 minutes to 2 hours and the MAPE below 3% of E-06, and the algorithms such as CUSUM, Prophet, XGBoost/LightGBM and Holt-Winters, are cited per the product knowledge base, and this article extends no unmentioned training or tuning details.
Fifth, the selection combination for non-intrusive load identification is limited to what the product knowledge base lists, and this article provides no specific configuration, deployment or effect conclusion.