Many IoT systems stress "connectivity": is the device online, is the data uploaded, does the platform display it. Weiwulian asks a different question — is that data useful: can it explain state, identify risk, guide maintenance, improve energy efficiency? "Weiwulian, a company that produces data" is therefore not a slogan but a summary of a technical route. This article covers the company-level positioning of data output; it neither repeats the method by which a distribution system moves from electrical parameters to condition diagnosis nor the evolution route from lightning protection to all-dimensional hazards .
1. Connection and Acquisition Are Only the Starting Point
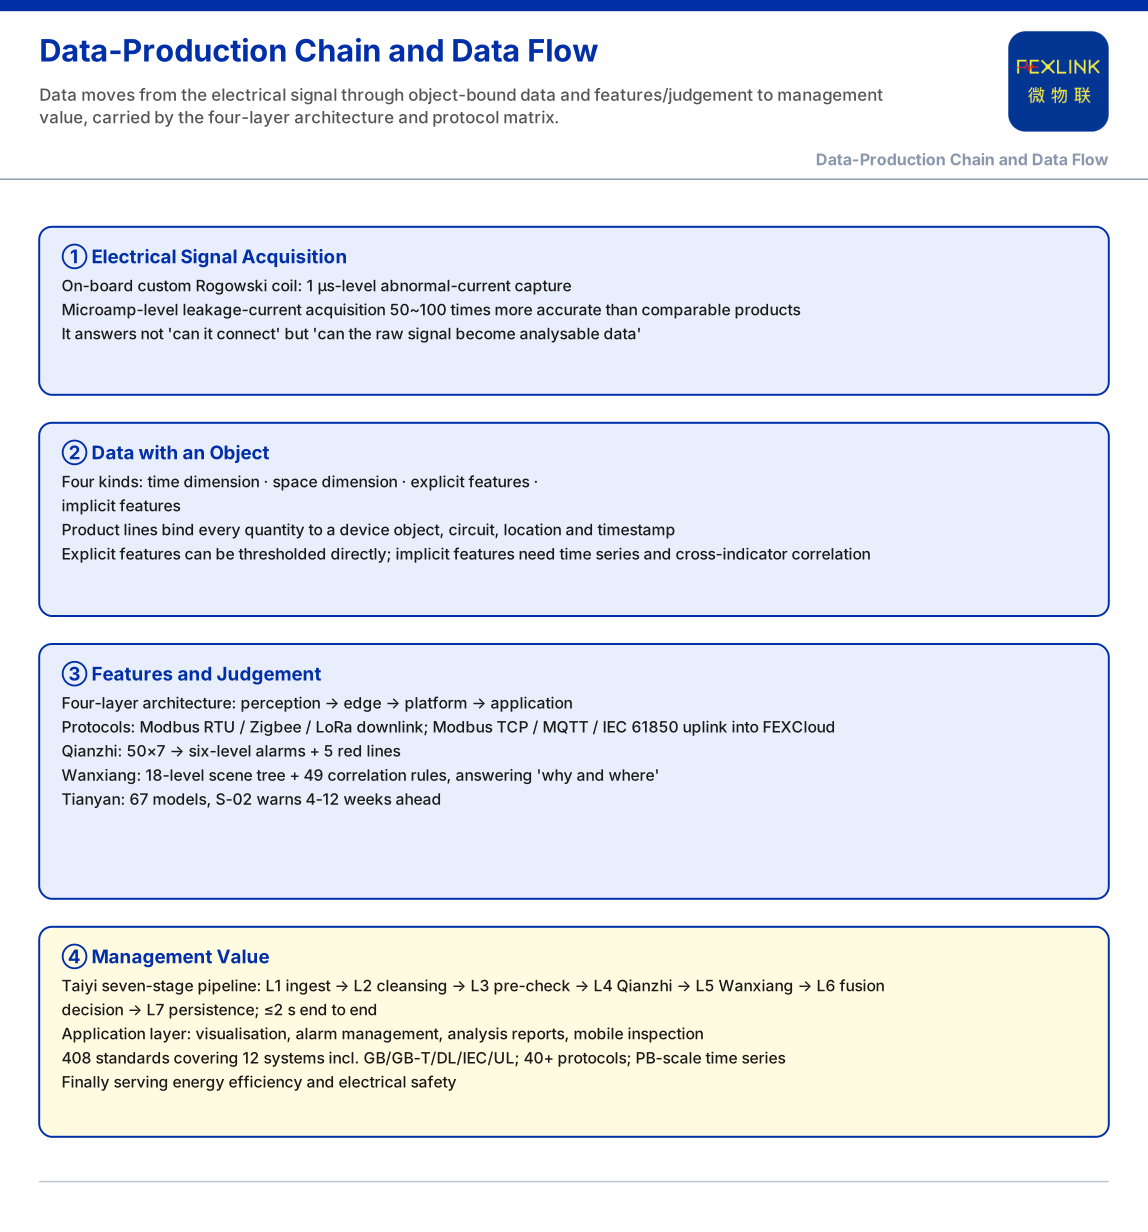
Wiring a device up and reading out a number is only the first step. A current, voltage or temperature value explains little without a device object, a time and relationships. The knowledge base describes the core sensor technology concretely: an on-board custom Rogowski coil captures abnormal current at the 1 μs level, and microamp-level leakage-current acquisition is 50~100 times more accurate than comparable products. These capabilities answer not "can it connect" but "can the raw electrical signal become analysable data".
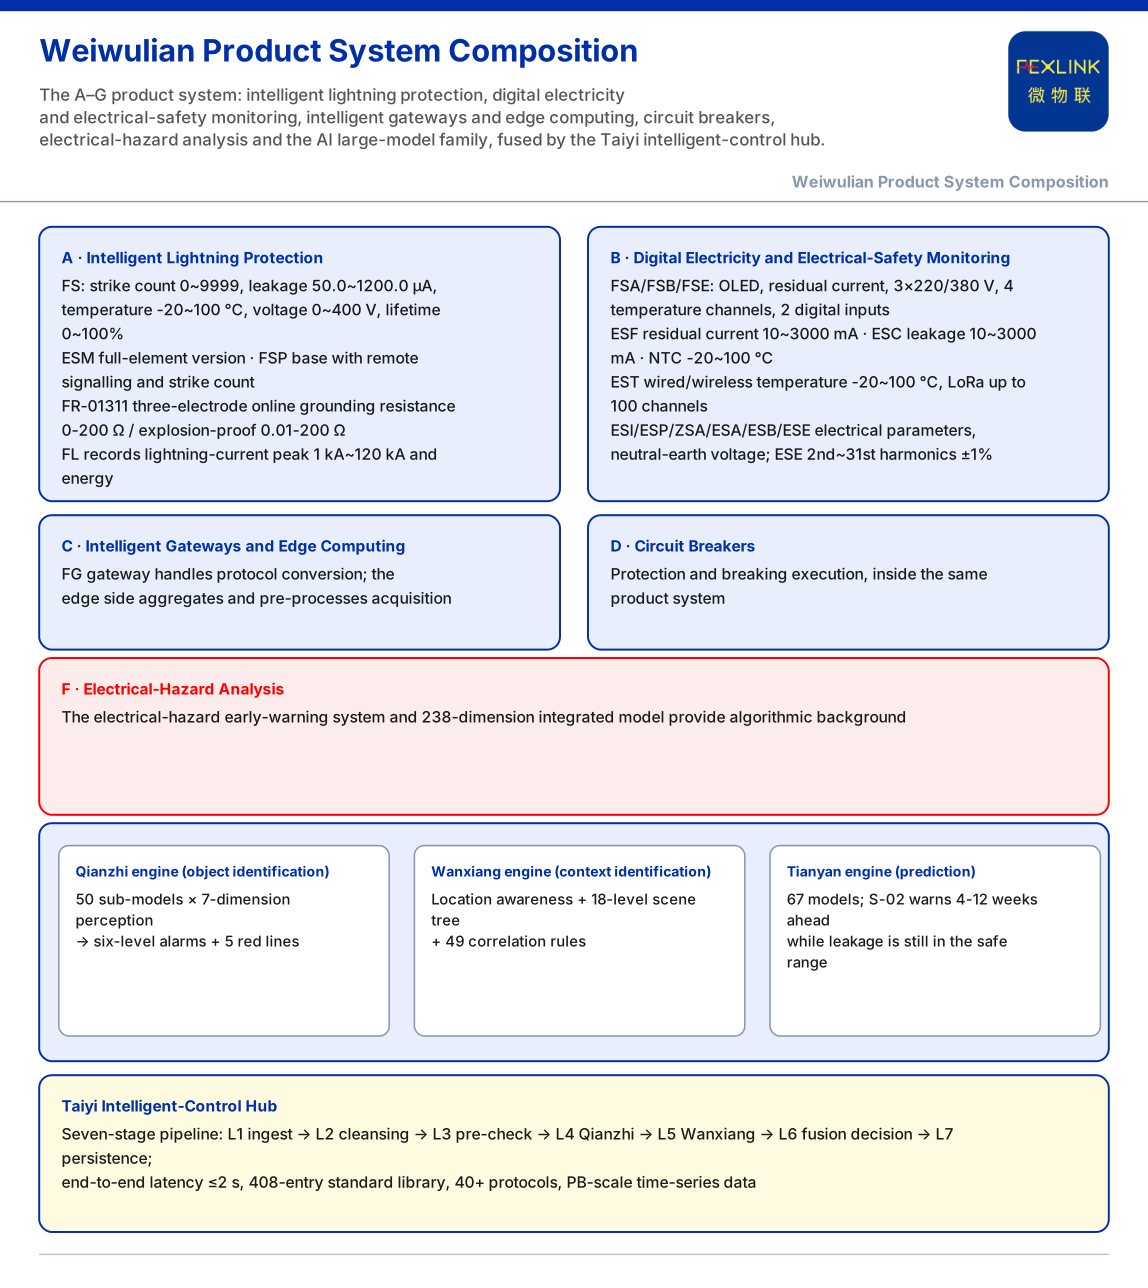
This is also why the knowledge base lists A intelligent lightning protection, B digital electricity and electrical-safety monitoring, C intelligent gateways and edge computing, D circuit breakers, F electrical-hazard analysis and G the AI large-model family within one product system: they are organised so acquired quantities can be further processed rather than stopping at connection counts and online rates.
2. What Kind of Data Weiwulian Produces
The time dimension, saying when an event happened; the space dimension, saying on which device, which circuit, which location it happened; explicit features, the directly observable electrical parameters such as voltage, current, temperature and leakage current; and implicit features, derived from waveform, frequency, trend and cross-indicator relationships. Together the four turn data from a "reading" into a "judgeable object". Their processing depths differ: explicit features can be thresholded directly, while implicit features often need time series and correlation; the time and space dimensions decide how the same reading differs across devices and locations.
3. Stage One: Turning an Electrical Signal into Data with an Object
The product lines recorded in the knowledge base are exactly the carriers of this stage. On the lightning-protection side, FS turns strike count 0~9999 (minimum trigger 0.1 kA), leakage current 50.0~1200.0 μA (±10 μA), temperature -20~100 °C (±1 °C), voltage 0~400.0 V (±0.1 V) and lifetime estimation 0~100% into uploadable data; ESM provides a full-element version, and the FSP base provides remote signalling and strike count; FR-01311 monitors grounding resistance online by the three-electrode method, with system-level ranges covering 0-200 Ω, 0-500 Ω and explosion-proof 0.01-200 Ω; FL records a lightning-current peak and energy of 1 kA~120 kA or 0.1 kA~1 kA; the FG gateway handles protocol conversion. On the electricity and electrical-safety side, FSA/FSB/FSE share OLED, residual current, 3×220/380 V, four temperature channels, two digital inputs, two relay outputs and meter monitoring; ESF has residual current 10~3000 mA and NTC -20~100 °C; ESC has leakage 10~3000 mA; EST measures temperature by wire or wirelessly at -20~100 °C, with LoRa up to 100 channels; and ESI, ESP, ZSA, ESA, ESB and ESE complete digital quantities, neutral-earth voltage and electrical parameters, with ESE providing 2nd~31st harmonics at ±1% accuracy. Only when these quantities carry a device object and a timestamp do they become manageable data.
Model naming follows the same structuring: FS is organised by voltage channels, leakage-current channels, temperature channels, digital inputs and grounding/strike segments; FSA/FSB/FSE current ratings step from 3×5 A to 3×1000 A; ZSA and ESA cover combinations from a basic meter to full-element metering. The product itself answers which device, circuit and location the quantity belongs to.
4. Stage Two: Turning Data into Features and Judgement
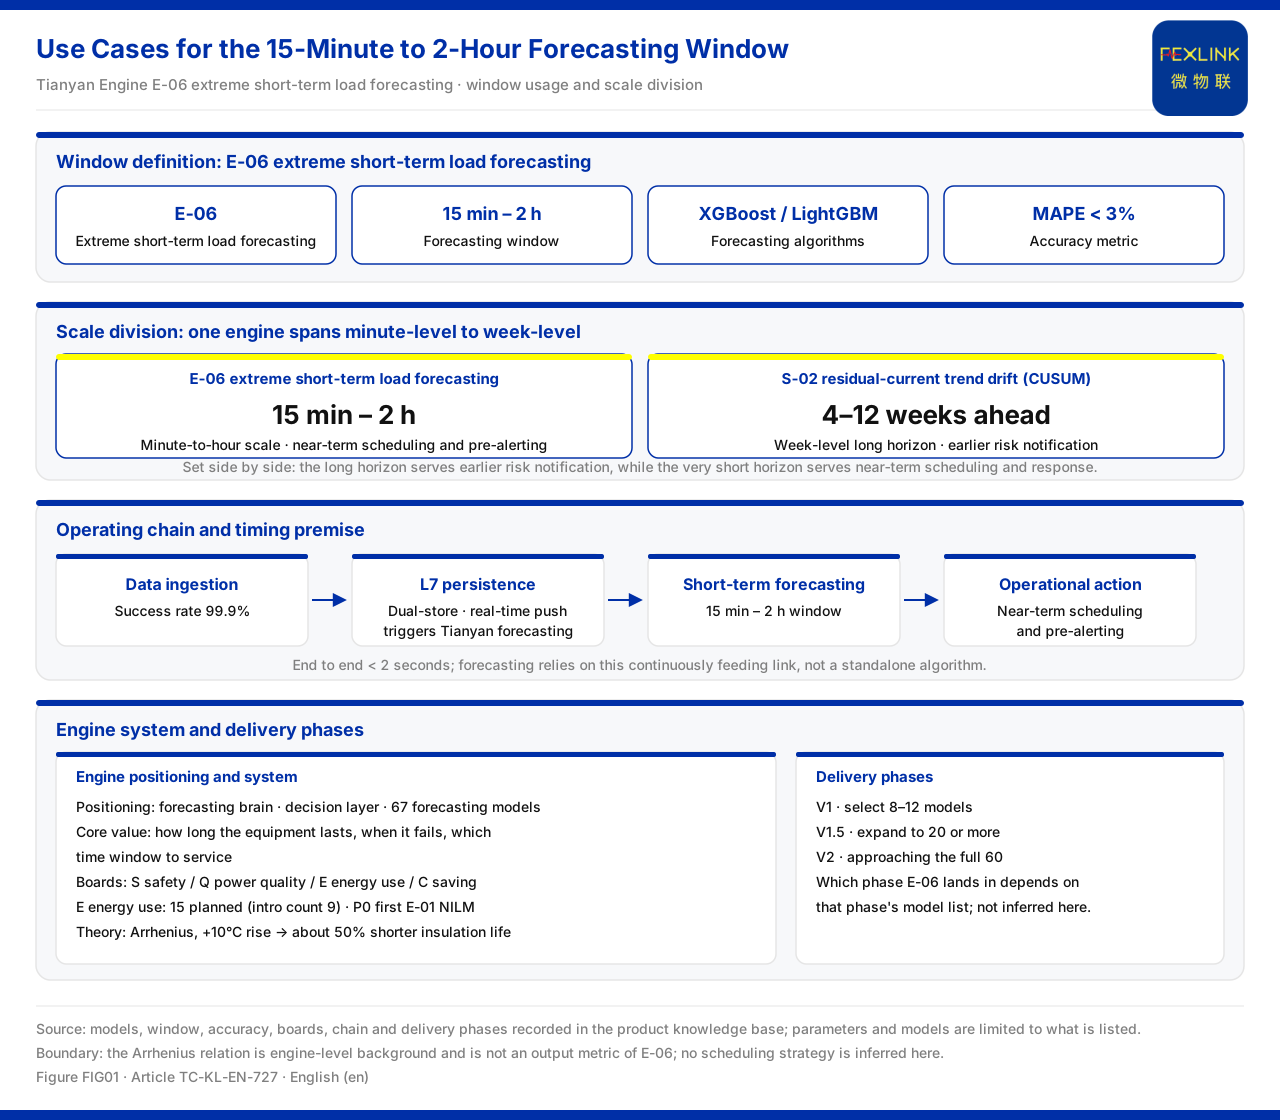
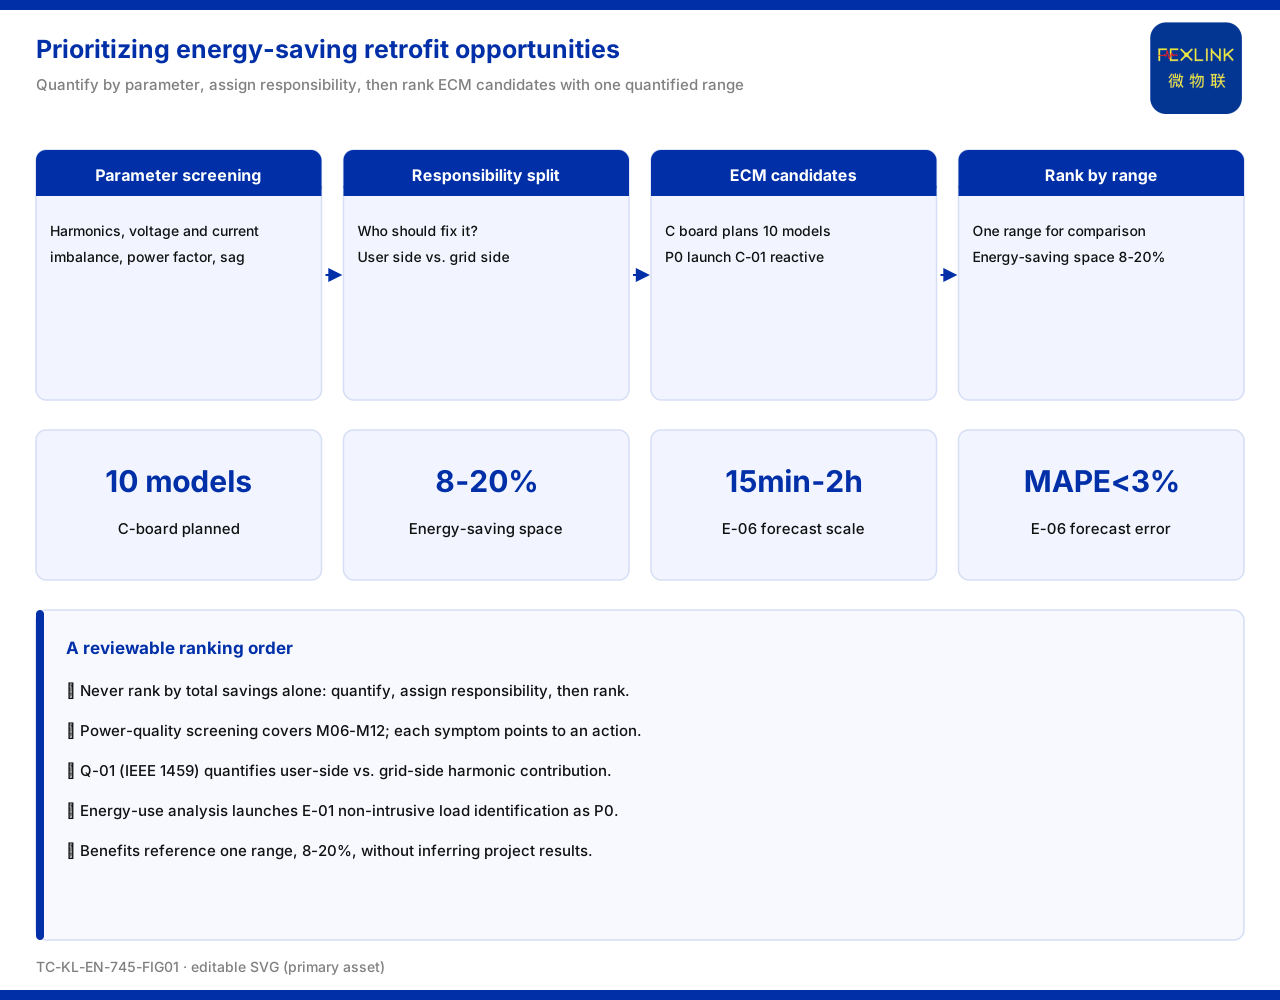
Having data also means having a way to read it. The knowledge base gives the four-layer architecture perception → edge → platform → application, with data going down via Modbus RTU, Zigbee and LoRa and up via Modbus TCP, MQTT and IEC 61850 into FEXCloud. The platform-side uplift comes from the AI family: the Qianzhi engine (object identification) turns parameters into features with 50 sub-models × 7-dimension perception and outputs six-level alarms plus five non-bypassable red lines; the Wanxiang engine (context identification) uses location awareness, an 18-level scene tree and 49 correlation rules to answer "why and where it is abnormal"; the Tianyan engine (prediction) uses 67 models to answer "how long it can last and when to act", with S-02 warning 4-12 weeks ahead while leakage is still in the safe range. Further down, Qianzhi's 20 core sub-models fall into basic vital signs, power-quality examination and deep-hazard mining; Wanxiang's four-dimension impact assessment weights safety, efficiency, lifetime and carbon dynamically; and besides S-02, Tianyan includes Q-01 harmonic responsibility allocation and E-01 non-intrusive load identification. This stage is the crux of "producing data": raw quantities are processed into features, judgement and prediction, not left on display.
The same curve produces different things at different processing levels: at the perception layer a sample, at the parameter layer a thresholded feature, at the scene layer a clue with location and cause, and at the prediction layer a time window for maintenance. This is the divide between "producing" and "acquiring".
5. Stage Three: Turning Judgement into Management Value
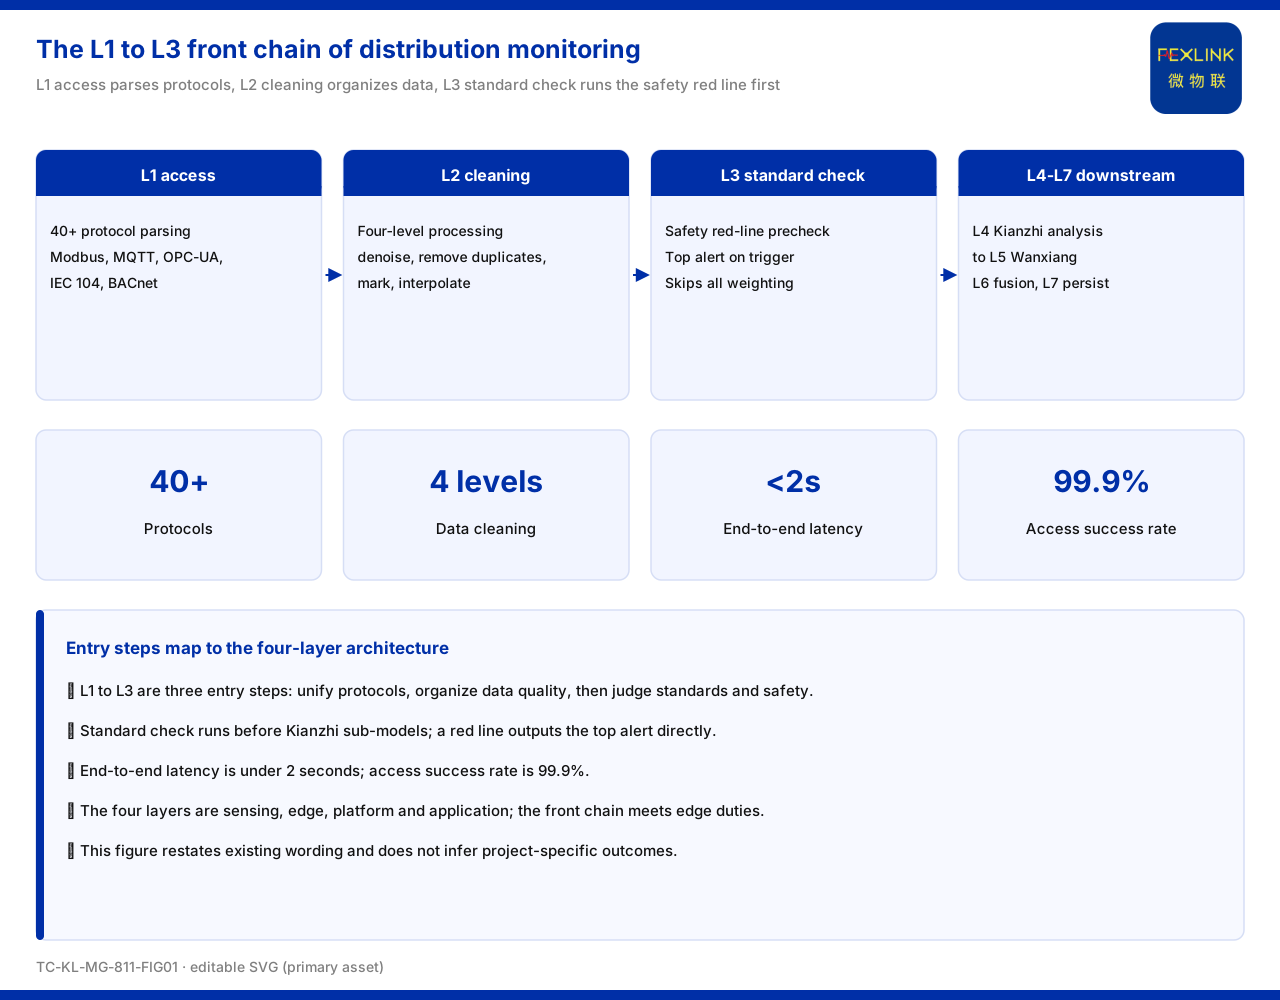
The last stage turns judgement into executable management value. The Taiyi intelligent-control hub keeps end-to-end latency within 2 seconds through a seven-stage pipeline (L1 ingest → L2 cleansing → L3 pre-check → L4 Qianzhi → L5 Wanxiang → L6 fusion decision → L7 persistence) and constrains red lines with a 408-entry standard library; the application layer then forms visualisation, alarm management, analysis reports and mobile inspection. On the standards-service side, the 408 standards cover 12 systems including GB, GB-T, DL, IEC and UL, completing clause matching and red-line locking before the algorithms; the Taiyi back end takes in PB-scale time-series data with 40+ protocols and four-level cleansing. For concrete scenarios, the electrical-hazard early-warning system and 238-dimension integrated model of provide algorithmic background. Only then does data output close the loop: from electrical signal through features and judgement to energy efficiency and electrical safety.
6. Boundaries: What This Article Does Not Claim
Second, the quantitative indicators in the knowledge base (electrical-hazard identification 95%+, alarm compression 80%, 4-12 weeks' warning lead, MTTR reduced 60%, energy-saving potential 8-20%) are vendor self-reports, and may only be cited as vendor capability claims. Third, the "90% of charging fires stem from undetected hazards" and the 238 dimensions and the KSDSFE3250220001 case are internal records, and are background only. Fourth, this article provides no data-governance systems, data-quality standards, data-asset catalogues or data-value measurement methods; claims no customer case, market share or performance guarantee; and invents no model, parameter or standard clause absent from the knowledge base, citing only the standard numbers listed in the knowledge base without inferring clause content. Fifth, it does not reuse the landing points of registered articles: the method moving a distribution system from electrical-parameter monitoring to condition diagnosis and the evolution route from lightning protection to all-dimensional hazards are not expanded.
Conclusion
Weiwulian is "a company that produces data" not by how many devices it connects, but because it turns electrical signals into data with objects, data into features and judgement, and judgement into management value: Rogowski coils and microamp acquisition at the perception end, the monitoring product lines, the four-layer architecture and protocol matrix, and the Qianzhi, Wanxiang, Tianyan and Taiyi seven-stage pipeline form a verifiable data-production chain.