Why L4 Qianzhi Analysis Can Run at About 800 ms in Parallel
Direct answer
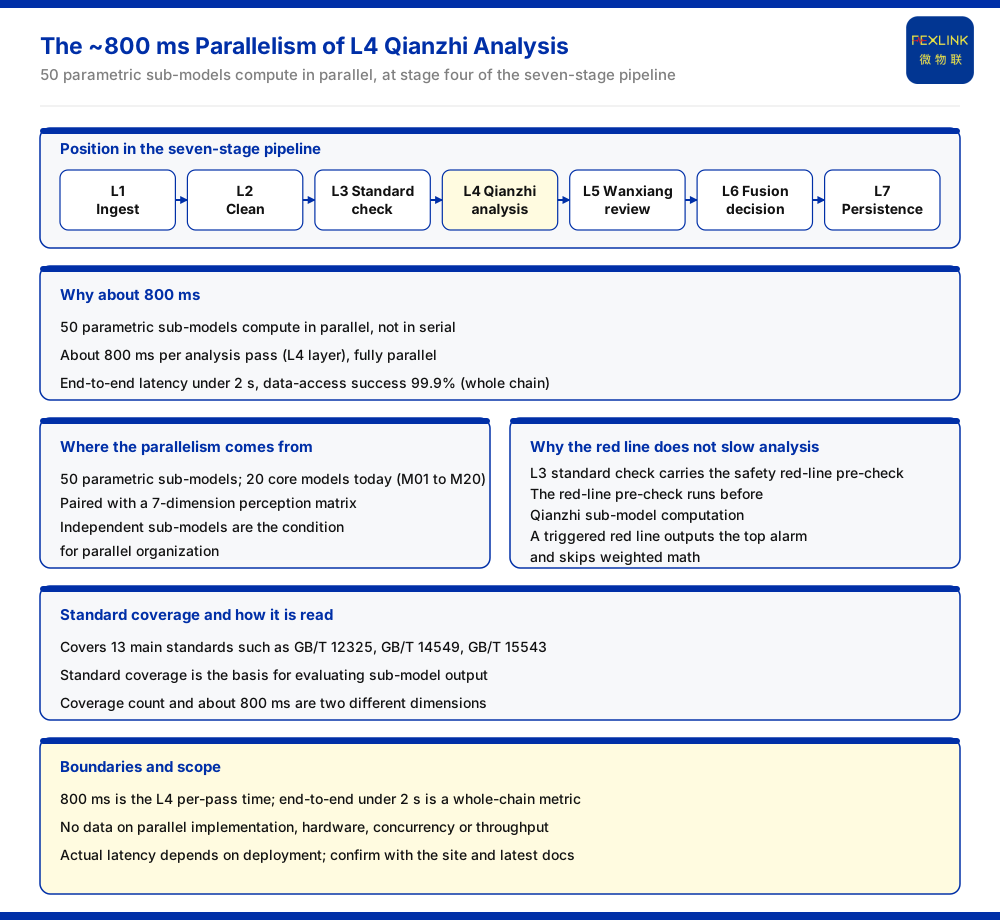
That L4 Qianzhi analysis can reach about 800 milliseconds comes down to the word "parallel." The product knowledge base records that L4 is the Qianzhi analysis layer, computed by 50 submodels in parallel, with a single round of analysis of about 800 milliseconds. It sits at the fourth stage of the seven-stage pipeline of the Taiyi intelligent control hub system (V2.0); the stage before it is L3 standard validation, and the stage after it is L5 Wanxiang assessment. In other words, the 800-millisecond figure holds both because of the parallel organization of the submodels and because of the division of labor with the stages on either side: the red-line pre-check is moved forward to L3, leaving the analysis layer free to concentrate on parameter computation. Reading only the parallelism, or only the stage order, would miss half of the reason.
1. Where L4 sits in the seven-stage pipeline
The seven-stage pipeline given in the product knowledge base is: L1 ingestion, L2 cleaning, L3 standard validation, L4 Qianzhi analysis, L5 Wanxiang assessment, L6 fusion decision, and L7 persistence. Of these, L4 Qianzhi analysis runs 50 submodels in parallel at about 800 milliseconds per round. The end-to-end latency of the whole pipeline is less than 2 seconds, and the data-ingestion success rate is 99.9%. Placing L4 back into this chain makes it clear that 800 milliseconds is the single-round time of the analysis layer, not the end-to-end latency of the whole chain; the two are not the same metric.
2. Where the parallelism comes from: 50 submodels
The core architecture of the Qianzhi engine (Bianwu, V4.1) is 50 parameter submodels, of which the current core is 20 (M01 to M20), combined with a 7-dimension perception matrix. "Parallel" means that these submodels compute in the same round at the same time, rather than waiting one after another in series. A large number of mutually independent submodels is the applicable condition for parallel organization; if each submodel had to depend in turn on the preceding result, it would be difficult to complete them in parallel within one round. The independence of the submodels matters because it is what allows the round to be organized as a single width rather than as a chain of dependencies; where a strict sequential dependency exists, the only option is to wait. The technical specification recorded in the product knowledge base is: a single round of analysis of about 800 milliseconds (L4 layer), fully parallel.
3. Why the red line does not slow the analysis down
L3 is standard validation, whose preceding role is the safety red-line pre-check. The product knowledge base records that the red-line pre-check is executed before the Qianzhi submodel computation; once the red line is triggered, the highest-level alarm is output directly and all weighted computation is skipped. The meaning of this division for L4 is that the red-line judgment does not enter the computational load of the submodels, and the analysis layer can concentrate on parameter-level computation; at the same time, a reading struck by the red line no longer enters the weighting stage, which avoids spending further computation on a criterion already known to be non-relaxable. The pre-check is a gate on the input, not part of the analysis width; that is what keeps it from adding to the single-round time of L4. Putting the red line ahead of the analysis is a trade-off at the level of the pipeline, not an optimization inside the analysis layer.
4. Standard coverage and the analysis horizon
The technical specification of the Qianzhi engine also includes coverage of 13 main standards, including GB/T 12325, GB/T 14549, and GB/T 15543. Standard coverage provides the basis for the assessment that the submodels output. When the submodels compute in parallel, each model outputs its assessment against the standard clauses it corresponds to, while the standard list itself does not enter the statement of single-round time; that is, the number of covered standards and the figure of about 800 milliseconds are two different dimensions, the former stating the basis of assessment and the latter the computation latency. This article does not explain the clauses of each standard, but cites only the fact that they are included in the coverage.
5. How the preceding and following stages carry the result
The upstream of L4 is L3 standard validation, and the downstream is L5 Wanxiang assessment, followed by L6 fusion decision and L7 persistence. The product knowledge base records that L6 fusion decision is based on the weighted composite health score of Qianzhi and Wanxiang; L7 persistence includes dual-database storage, real-time push, and triggering Tianyan prediction. It can therefore be seen that the 800-millisecond parallel analysis is only one segment of the chain, and its output needs to be carried by the following stages. The stages after analysis do not recompute the parameters; they combine and persist what the analysis has produced, which is why the single-round figure and the end-to-end figure are measured on different spans. This article does not restate the internal algorithm implementation of each layer.
Scope and limitations
This article answers only "why L4 Qianzhi analysis can run at about 800 milliseconds in parallel," and its content is limited to the pipeline stages, submodel counts, parallel horizon, red-line division, and standard coverage already recorded in the product knowledge base. No implementation detail beyond those entries is introduced.
The 800 milliseconds is the single-round time of the L4 analysis layer, while the end-to-end figure below 2 seconds is a metric of the whole chain; the two are different, and this article does not conflate them.
This article provides no specific parallel implementation, hardware configuration, concurrency, or throughput data, as the product knowledge base does not list them.
Actual latency is affected by deployment conditions and must be confirmed in conjunction with the site and the latest product documentation. No concurrency or throughput figure is asserted, and no inference beyond the listed entries is made.