How does meter data support energy analysis and carbon management?
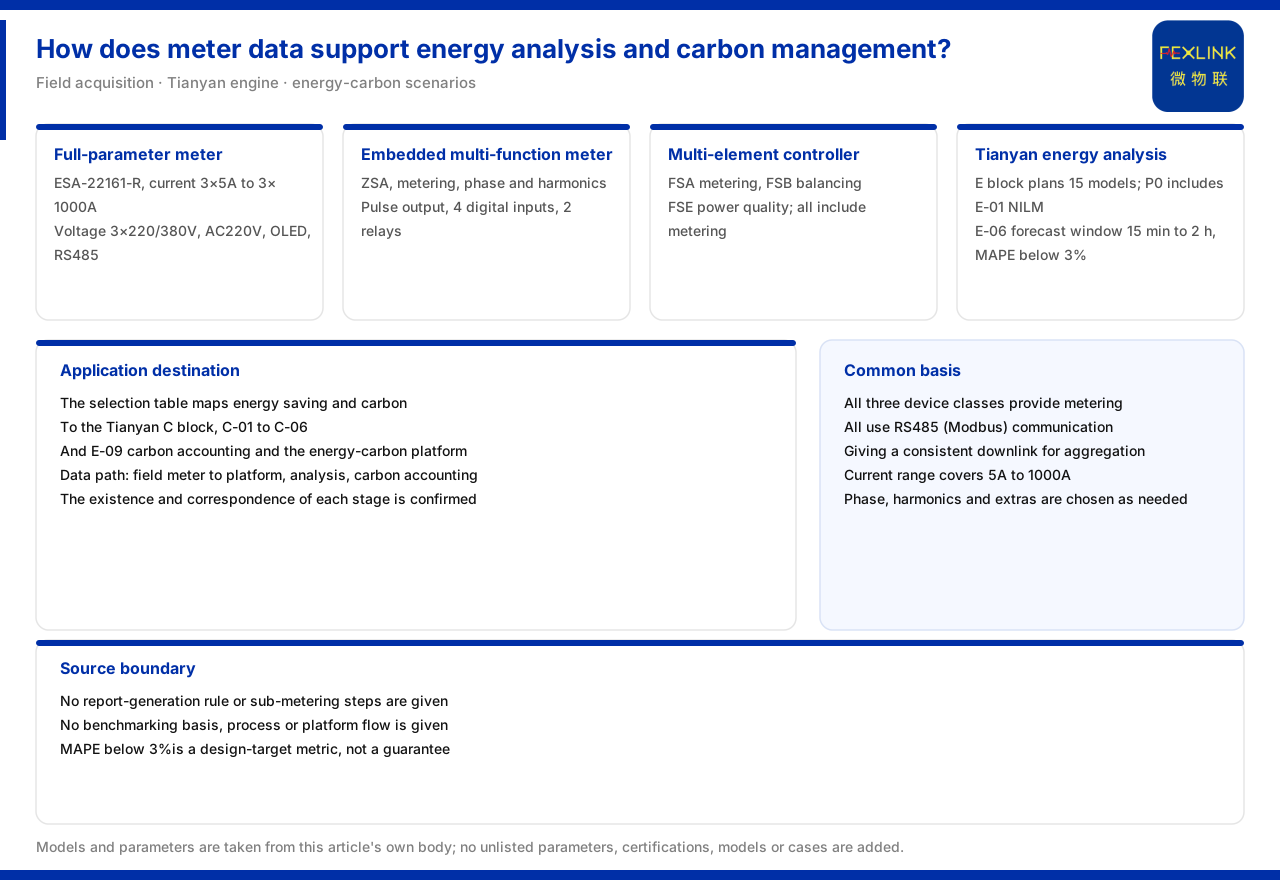
Direct answer: from the existing product material it can be confirmed that meter data is the starting point of a data link leading to energy analysis and carbon management. One end of the link is devices with meter-monitoring capability, such as the all-parameter smart meter (a model such as ESA-22161-R), the embedded multi-function smart meter (ZSA) and the multi-parameter electrical intelligent controller (FSA/FSB/FSE); the other end is the energy-analysis board of the Tianyan engine and the energy-saving and carbon-management scenario in the selection comparison. In the selection comparison the material maps "energy saving and carbon management" to the Tianyan engine C board (C-01 to C-06), E-09 carbon accounting and the smart energy-carbon platform, showing that meter energy data can connect to the energy-saving and carbon-management scenario. But the material gives no specific algorithm step or platform operation flow for generating an energy report, sub-item metering or energy-efficiency benchmarking from meter data, so "whether the data can connect" can get an answer from the material, while "how reports and benchmarking are computed" still needs separate confirmation.
The completeness of this link depends on three things: whether field meters can acquire the needed electrical quantities, whether the data can go up through communication and platform, and whether the energy-analysis model can interpret the data. The material gives relatively definite parameters for the first two and gives model names and some indicators for the third, but no operational steps from raw data to an analysis result.
Field end: which devices provide meter monitoring
The all-parameter smart meter supports meter monitoring across the whole series, with a current range from 3 × 5 A to 3 × 1000 A, a voltage of 3 × 220/380 V, AC220V supply, an OLED display and RS485 (Modbus) communication. These parameters determine the circuit scale it can cover: a current span from 5 A to 1000 A means the same product series can correspond to circuits of different capacity.
The embedded multi-function smart meter provides, by model, meter monitoring, phase, harmonics, pulse output, switching values (4 channels) and relays (2 channels), with the whole series supplied at AC220V and an OLED display. Compared with the all-parameter smart meter, it brings power-quality elements such as phase and harmonics into the optional range. The multi-parameter electrical intelligent controller (FSA/FSB/FSE) contains meter monitoring across the series and differentiates additional monitoring capability by the FSA meter type, the FSB three-phase balance type and the FSE power-quality type. Meter-monitoring capability is thus distributed across several product lines, and selection should decide the specific product by "which additional monitoring is needed".
The common point of these three classes of device is that all provide meter monitoring and RS485 (Modbus) communication. This provides a consistent downlink basis for energy data to aggregate upward.
Analysis end: energy analysis and load forecasting of the Tianyan engine
The material shows that the E energy-analysis board of the Tianyan engine is planned with 15 models (9 in the documentation definition), among which the P0 first release includes E-01 NILM non-intrusive load decomposition. The meaning of NILM is to decompose sub-item loads from total energy data, which is the algorithm-side counterpart of "sub-item metering". However, the material gives only the model number and name, not its algorithm steps.
On load forecasting, the material gives E-06 extremely short-term load forecasting: using XGBoost/LightGBM, with a forecast window of 15 min to 2 h and a MAPE of less than 3%. These parameters show that extremely short-term forecasting has a definite window and accuracy target. But note that a MAPE of less than 3% is an indicator definition the material gives, not a guarantee reachable at any site and any data quality; it describes a model design target, not a universal guaranteed value.
Model names and indicators can support the statement "what analysis capability exists" but not the operational description "how an analysis result is obtained from meter data". The two must not be conflated.
Application end: where the data of energy saving and carbon management goes
In its selection comparison the material maps "energy saving and carbon management" to the Tianyan engine C board (C-01 to C-06), E-09 carbon accounting and the smart energy-carbon platform. This mapping shows that the energy data acquired by meters can enter the energy-carbon management scenario and be hosted jointly by the C board's analysis capability, E-09's carbon-accounting capability and the smart energy-carbon platform.
From the data-flow view this forms the link "field meter to platform to energy analysis to carbon accounting". The material confirms the existence and mapping of each link but does not develop the interface, data format, update frequency or calculation window between them. A scheme can therefore describe "meter data connects to the energy-saving and carbon-management scenario", but cannot infer a specific calculation flow from it.
Algorithm steps and operation flow the material does not give
First, no energy-report generation rule. The material does not say by what period a report is aggregated, which fields it contains, or how it is grouped into sub-items.
Second, no specific step for sub-item metering. Although NILM belongs to the sub-item load-decomposition direction, the material gives no algorithm step or parameter-configuration method for non-intrusive decomposition.
Third, no benchmark or flow for energy-efficiency benchmarking. The material gives no way to select a benchmarking baseline or judge a deviation.
Fourth, no platform operation flow. How the smart energy-carbon platform is configured, how results are viewed and how reports are exported are not stated by the material.
Fifth, no data-quality requirement. Requirements such as sampling frequency, missing-data handling and anomaly filtering for meter data are not given by the material.
These five points all belong to the implementation level of "from data to conclusion". What the material can answer is "which meters exist, which quantities can be acquired, and which models and scenarios exist", and what it cannot answer is "how reports and benchmarking are computed and operated".
A checklist to complete before implementation
1. Clarify circuit capacity. Choose a current grade matching the site circuit within the specification range of 3 × 5 A to 3 × 1000 A. 2. Determine the additional monitoring needed. Beyond meter monitoring, choose functions such as phase, harmonics, switching values or relays as needed. 3. Unify communication and uplink. Confirm that field devices access over RS485 (Modbus) and clarify the aggregation path of data to the platform. 4. Distinguish "capability" from "steps". A scheme may describe models and scenarios but must not invent the operation flow of reports and benchmarking. 5. Review indicator definitions separately. Indicators such as a MAPE of less than 3% should be noted as the material definition, and actual effect must be verified against site data.
Summary
The link through which meter data supports energy analysis and carbon management is clear: the all-parameter smart meter, the embedded multi-function smart meter and the multi-parameter electrical intelligent controller provide meter-monitoring capability, the E energy-analysis board of the Tianyan engine provides models such as NILM and extremely short-term load forecasting, and the selection comparison maps energy saving and carbon management to the C board, E-09 carbon accounting and the smart energy-carbon platform. What the material can support is these device capabilities, model names and scenario mappings; what it cannot support is the algorithm steps and platform operation flow of energy reports, sub-item metering and energy-efficiency benchmarking.
For an engineer, the safe approach is to fix the field meter selection and communication aggregation first and then leave the report and benchmarking needs to the platform side; for review and delivery, one should check whether a scheme writes model names as an executable flow or treats an accuracy indicator as a universal guarantee. Keeping "data link" and "calculation flow" apart makes an energy-analysis and carbon-management scheme both grounded and implementable.