Direct Answer
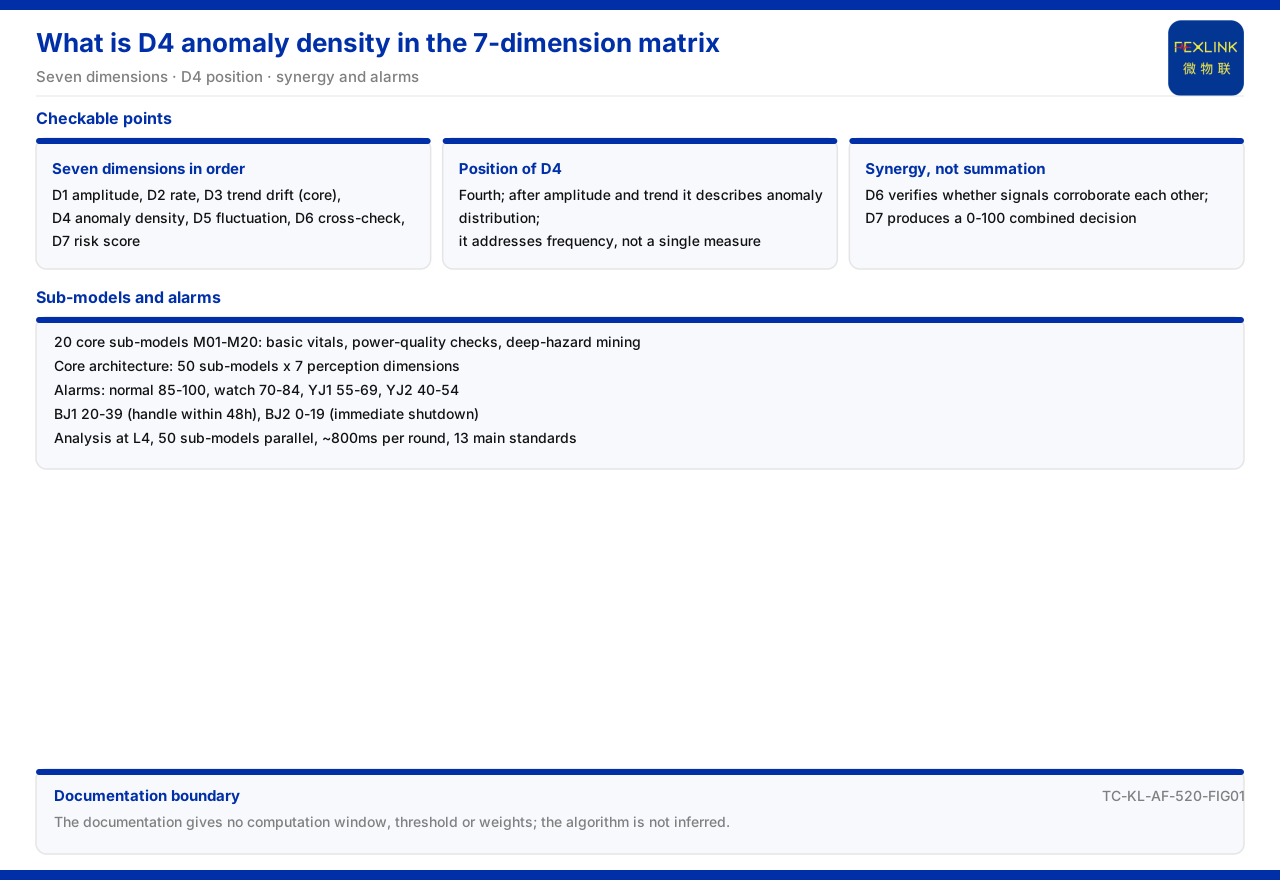
In the 7-dimension perception matrix of the Qianzhi engine, D4 is the abnormal-density dimension. The seven dimensions given in the product documentation are, in order, D1 amplitude, D2 rate of change, D3 trend drift (core), D4 abnormal density, D5 fluctuation amplitude, D6 correlation verification, and D7 time-series risk score (0-100 composite decision). Abnormal density focuses on how densely anomalies occur per unit time or per unit sample; unlike single measurements such as amplitude and rate of change, it describes how sparse or dense the distribution of anomalies is. The key to understanding D4 is to place it back in the seven-dimension structure: it does not conclude alone but supports the later composite score together with the other dimensions. This article cites only the dimension names, order, and definitions listed in the product documentation and does not infer the specific algorithm of D4.
1. The Overall Structure of the 7-Dimension Perception Matrix
The 7-dimension perception is not seven independent indicators but a matrix with a clear division of labor. The documentation lists them in order: D1 amplitude, D2 rate of change, D3 trend drift, D4 abnormal density, D5 fluctuation amplitude, D6 correlation verification, and D7 time-series risk score. D3 trend drift is marked as the core dimension, and D7 time-series risk score gives the 0-100 composite decision result.
Grouping the seven by nature makes this clearer: D1, D2, and D5 measure the signal itself; D3 portrays the temporal trend; D4 portrays the frequency with which anomalies appear; D6 verifies the relationship between different signals; and D7 is a summary output. The matrix therefore contains both perception dimensions on the input side and a composite score on the output side, and D4 sits on the input side, toward "distribution."
2. The Position of D4 Abnormal Density in the Matrix
D4 occupies the fourth position of the seven, after amplitude, rate of change, and trend drift, and before fluctuation amplitude, correlation verification, and the time-series risk score. This position itself defines its role: after the amplitude and trend of a single signal have been portrayed, it further portrays how dense the anomalies are.
By name, "abnormal density" contains two layers: "abnormal," which requires an anomaly judgment first, and "density," which concerns not a single anomaly but how sparse or dense anomalies are in the sample. This distinguishes it from D1 amplitude — amplitude answers "how large the value is," while abnormal density answers "how often anomalies appear." The two may appear together or diverge: low amplitude with frequent anomalies is a different form from higher amplitude with a single occasional occurrence. The documentation gives no calculation window or threshold for abnormal density, so this article states only that the dimension describes the distribution density of anomalies and does not supplement calculation details.
3. Why Abnormal Density Is an Independent Dimension
Abnormal density is an independent dimension because frequency itself carries information that amplitude does not. A persistent low-grade anomaly and an occasional large-amplitude anomaly do not mean the same thing to the system; amplitude alone cannot distinguish them, and rate of change can hardly portray their recurrence. Listing "how often it appears" separately is exactly what supplies this dimension of information.
At the same time, D4 is neither ranked highest nor marked as core. The documentation marks only D3 trend drift as the core dimension, showing that in the design of the Qianzhi engine trend is weighted more heavily than single-point anomaly frequency. Understanding this weighting helps avoid reading "high abnormal density" directly as "highest risk"; the documentation gives no such correspondence, and this article does not infer one.
4. How the Seven Dimensions Cooperate
The seven dimensions cooperate rather than simply adding up. The existence of D6 correlation verification shows that the system checks whether different signals or dimensions corroborate each other; the existence of D7 time-series risk score shows that the final output is a 0-100 composite result rather than a single reading from one dimension. In this cooperation, D4 supplies the "anomaly frequency" input alongside amplitude, rate of change, trend, and fluctuation for later judgment.
The boundary to hold is that the documentation lists only the names and order of the seven dimensions and the composite score interval of D7, without giving the weight of each dimension, the mapping formula from D4 to D7, or a single handling rule when one dimension is abnormal. This article therefore explains only the cooperative relationship and each role, and does not infer a weighting method or treat D4 separately as an independent conclusion.
5. The Three Groups of the 20 Specialized Sub-Models
The 7-dimension perception does not run in isolation; it works with the sub-model system of the Qianzhi engine. The documentation records that the core architecture of the Qianzhi engine is 50 parameter sub-models, of which 20 core sub-models are currently present, numbered M01 to M20 and grouped into three classes: M01 to M05 as basic vital signs, M06 to M12 as power-quality physical examination, and M13 to M20 as deep hazard mining.
The three groups reflect a progression from basic to deep: basic vital signs correspond to the most fundamental operating state, power-quality physical examination to power-quality parameters, and deep hazard mining to more concealed problems. The 7-dimension perception and these sub-models together form the core architecture of "50 sub-models times 7-dimension perception." The documentation gives the sub-model count and the perception-dimension version together, and this article cites them on that basis without supplementing unlisted sub-model numbers or functions.
6. How Results Fall into Graded Alarms
Analysis results finally fall into graded alarms. The alarm system in the documentation is: normal (85-100), Watch (70-84), YJ1 (55-69), YJ2 (40-54), BJ1 (20-39, handling within 48 hours), and BJ2 (0-19, immediate shutdown). Every alarm carries a standard-clause reference, a four-dimension impact label, a confidence value, and a scenario label. The 0-100 composite score of D7 therefore connects to this grading: whichever interval the score falls into corresponds to that alarm level.
In the overall flow, Qianzhi analysis sits at stage L4 of the seven-stage pipeline, with 50 sub-models executing in parallel in about 800ms per round and covering 13 main standards including GB/T 12325, GB/T 14549, and GB/T 15543. The boundary to hold is that this article cites only the pipeline stage, the parallel mode, the per-round time definition, and the number of standards; it does not infer a site's actual elapsed time from 800ms and does not treat the standard coverage count as a certification conclusion.
Scope and Limitations
First, this article restates only what the product documentation lists, and its factual boundary is limited to the core architecture of the Qianzhi engine, the 7-dimension perception matrix, the grouping of the 20 sub-models, the alarm system, and the seven-stage pipeline.
Second, the dimension names and order of the 7-dimension perception matrix, with D3 as the core dimension and D7 as the 0-100 composite decision, are cited as listed; this article does not supplement the weight of each dimension or the calculation method of D4.
Third, that D4 abnormal density describes the distribution density of anomalies is a general explanation derived from the dimension name and its position in the matrix; the documentation gives no calculation window or threshold for abnormal density, and this article does not infer a specific decision from it.
Fourth, the grouping of the 20 core sub-models as M01-M05, M06-M12, and M13-M20 and their meanings are cited as listed; this article does not supplement unlisted sub-models.
Fifth, the intervals, handling requirements, and accompanying information of the graded alarms are cited as listed in the alarm system; this article does not equate D4 alone with any alarm level.
Sixth, that Qianzhi analysis sits at pipeline stage L4, with 50 sub-models in parallel, about 800ms per round, and coverage of 13 main standards, is cited as listed in the technical specifications; this article does not infer site performance or certification conclusions, and the latest product documentation and formal documents prevail in practice.