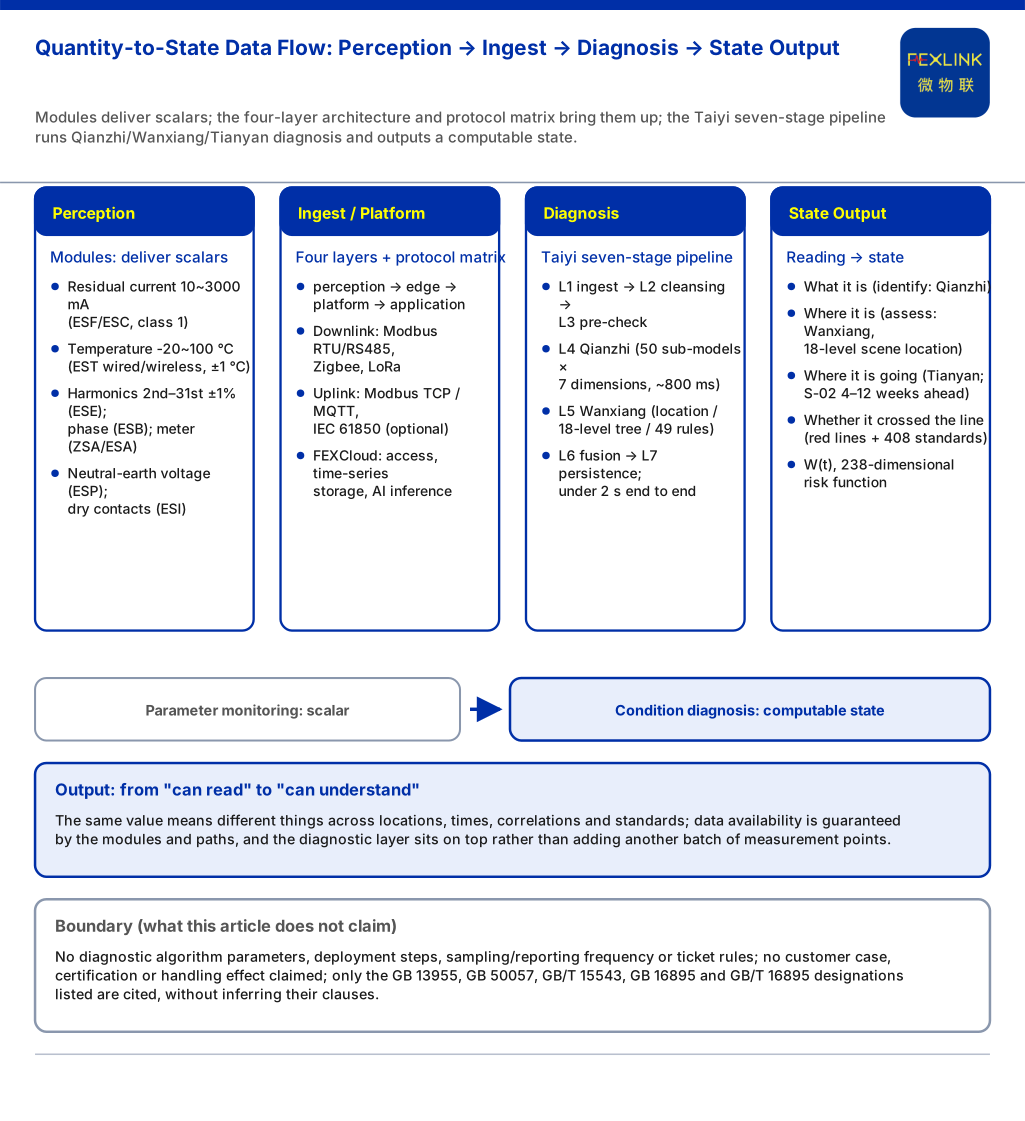
Distribution systems never lack measurement. A smart meter reads voltage, current and power; a residual-current controller reads leakage; a temperature module reads terminal heat. The problem is that these numbers barely constitute a judgement on their own. The same 65 °C may be normal on a transformer winding yet already high-risk on an outgoing feeder terminal; the same harmonic reading is merely "a bit high" in isolation, and only becomes meaningful when matched against an equipment fingerprint library. "Condition diagnosis" answers four things: where this value sits, which quantities it travels with, which way it is heading, and what it means against a given standard. This article explains why distribution needs that step, and what the "quantity to state" capability chain in the knowledge base consists of.
1. Electrical Parameter Monitoring Delivers a Scalar
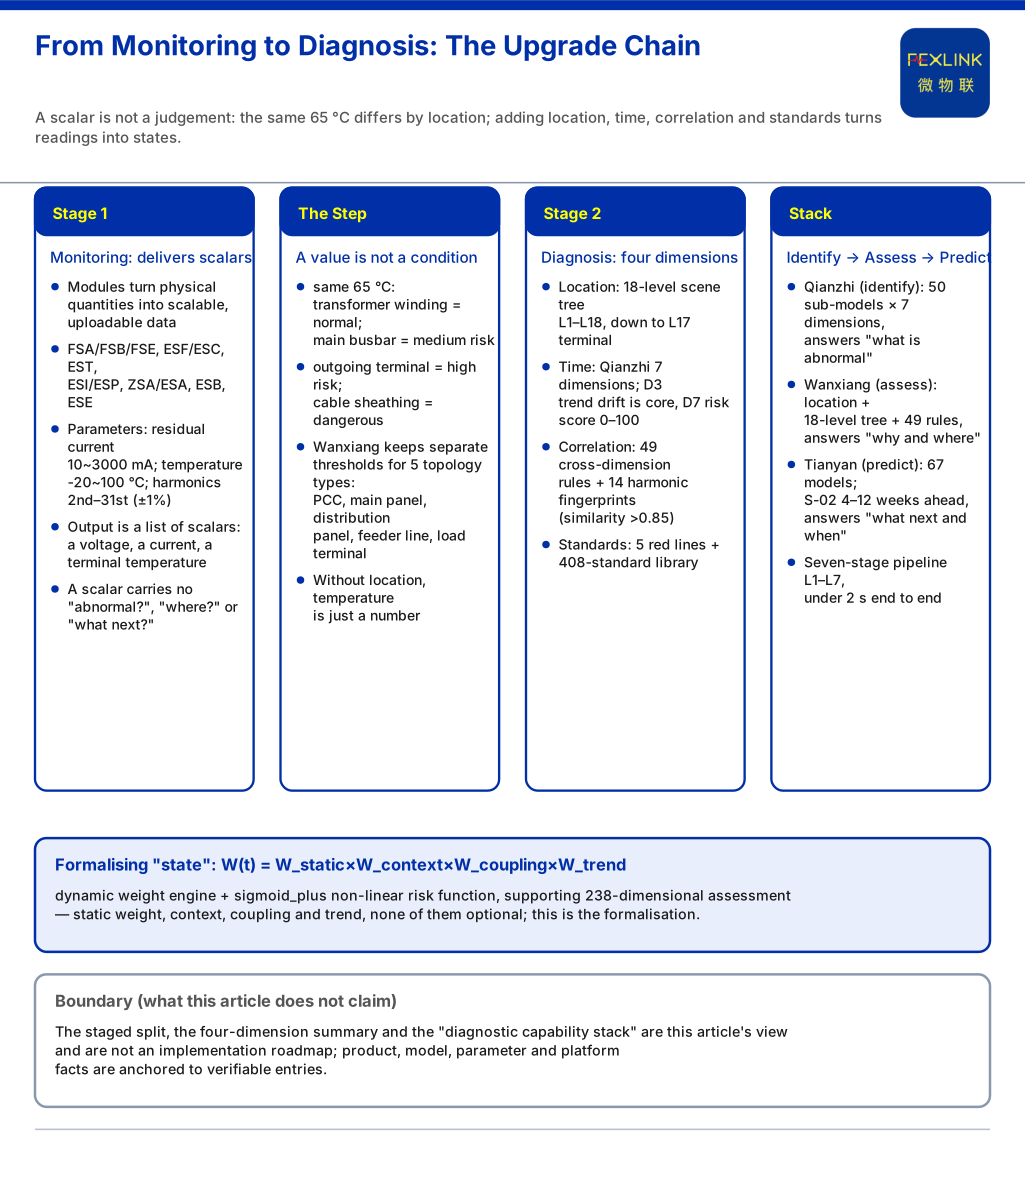
The knowledge base covers the continuous quantities on the distribution and consumption side with a whole product line. The FSA/FSB/FSE multi-element intelligent controllers share one residual-current channel, 3×220/380 V, four temperature channels, two digital inputs, two relay outputs and meter monitoring; the ESF electrical-fire controller covers residual current 10~3000 mA (class 1) and NTC -20~100 °C; the ESC multi-channel leakage controller covers 10~3000 mA; the EST multi-channel temperature controller offers wired NTC and wireless active measurement at -20~100 °C; the ESI digital-state monitor collects dry contacts; the ESP monitors neutral-to-earth voltage; the ZSA embedded and ESA all-element smart meters provide meter monitoring; the ESB three-phase unbalance monitor adds phase monitoring; and the ESE power-quality monitor adds 2nd–31st harmonic monitoring at ±1% on top of phase.
These modules turn physical quantities into scalable, uploadable data — the starting point of monitoring. Yet what reaches the operator is essentially a list of scalars: a voltage at one moment, a current on one circuit, a temperature at one terminal. A scalar carries no information about whether it is abnormal, where the abnormality is, or what comes next.
2. A "Value" Is Not a "Condition": Same Number, Different Place, Different Meaning
Why is there a step between seeing a value and making a diagnosis? The location awareness is the clearest answer: the same 65 °C reads normal on a transformer winding, medium-risk on the main busbar, high-risk on an outgoing terminal and dangerous on cable sheathing; the Wanxiang engine maintains separate thresholds and risk models for five electrical topology position types — PCC point, main panel, distribution panel, feeder line and load terminal. Away from location, temperature is just a number.
The same holds for correlation. The 49 cross-dimension correlation rules show that a single quantity gains meaning from the shape it forms with others: a CR-series rule points from rising leakage plus abnormal temperature to combined insulation degradation; a TEMP-CORR-series rule points from rising temperature with unchanged current to increased contact resistance; a VOLT-series rule points from high harmonics with reactive compensation engaged to resonance risk; a CURR-series rule points from persistent zero-sequence current to single-phase earth tracing. A leakage value plus a temperature value becomes the condition "combined degradation" only inside the rules.
3. From Quantity to State: Four Missing Dimensions
Summing up the examples, condition diagnosis adds four dimensions to electrical parameter monitoring.
First, location. The 18-level scene-location tree (L1 campus → building → floor → distribution area → … → L17 terminal level → L18 contact level) lets an alarm resolve to "workshop 3, power cabinet, feeder 5 terminal". Location gives a threshold its context.
Second, time. In the seven-dimension perception matrix, D1 amplitude is only one dimension, D3 trend drift is core, and D7 outputs a 0-100 time-series risk score. The same amplitude at rest and mid-drift are two different states.
Third, correlation. Beyond the 49 rules, the harmonic fingerprint library holds 14 equipment fingerprints (such as three-phase rectifiers, six-pulse inverters, UPS, EV chargers and PV inverters), matched at cosine similarity above 0.85, so "high harmonics" becomes "which equipment is polluting", with pollution source locked in 2 hours.
Fourth, standards. The five red lines and the 408-standard library provide the institutional criteria for whether a state has crossed the line.
Only when the four are layered does data move from "reading" to "state": what it is, where it is, where it is going, and whether it has crossed the line.
4. The Diagnostic Capability Stack: Identification, Assessment, Prediction
If condition diagnosis is its own layer, what composes it? The knowledge base divides the AI family by duty into Qianzhi (identify), Wanxiang (assess) and Tianyan (predict). Qianzhi is parameter-level perception, answering "what is abnormal" with 50 sub-models × 7 dimensions; Wanxiang is scene-level assessment, answering "why and where" with location awareness, the 18-level scene tree and 49 correlation rules; Tianyan is predictive analysis, answering "what happens next and when to act" with 67 prediction models across S safety, Q power quality, E energy and C conservation. The seven-stage pipeline (L1 ingest → L2 cleansing → L3 pre-check → L4 Qianzhi analysis → L5 Wanxiang assessment → L6 fusion decision → L7 persistence, under 2 seconds end to end) threads these layers into one diagnostic chain.
More telling is the integrated electrical-hazard analysis model: its dynamic weight engine is written W(t)=W_static×W_context×W_coupling×W_trend, with a sigmoid_plus non-linear risk function supporting 238-dimensional electrical-parameter assessment. The formula is itself a formalisation of the four dimensions — static weight, context, coupling and trend; remove one and it is no longer a "state".
5. What This Means for Distribution Engineering
To be clear, moving toward condition diagnosis does not overturn existing parameter monitoring. On the contrary, it builds on it: the four-layer architecture (perception → edge → platform → application) defines where data comes from; the protocol matrix (downlink Modbus RTU/RS485, Zigbee, LoRa; uplink Modbus TCP/MQTT, IEC 61850 optional) determines whether it can come up at all; the selection matrix gives the combinations for different scenarios. The diagnostic layer is a judgement layer on top of these paths, not another batch of measurement points.
6. Boundaries: What This Article Does Not Claim
Second, the "90% of charging fires stem from undetected hazards", the KSDSFE3250220001 case (3rd harmonic 18.7× over limit, combined risk 75.5%) and the 238-dimensional model are the knowledge base's internal records; they serve as background only.
Third, the quantitative value indicators (hazard identification 95%+, alarm compression 80%, root-cause accuracy 85%+, fault location days to 2 hours) are vendor self-reports. Cite them only as vendor capability claims, never as guarantees or procurement grounds.
Fourth, this article does not repeat other articles' landing points: it does not carry the capability roadmap, the case for moving ahead of failure, or the single-quantity topics (voltage, current, leakage, temperature, arc). It answers only why monitoring must become diagnosis and which verifiable capabilities compose it.
Fifth, it gives no diagnostic algorithm parameters, deployment steps, sampling or reporting frequency, ticket rules or evidence formats; claims no customer case, certification or handling effect; and cites only the GB 13955, GB 50057, GB/T 15543, GB 16895 and GB/T 16895 designations listed in the knowledge base without inferring their clauses.
Conclusion
Electrical parameter monitoring solves "can we read it"; condition diagnosis solves "can we understand it". Because the same value means entirely different things in different locations, times, correlations and standards, scalars alone cannot support judgement. The knowledge base's path is: make data available with the modules and four-layer architecture; lift quantity to state with Qianzhi's parameter-level perception, Wanxiang's scene-level assessment and Tianyan's prediction; hold the judgement baseline with red lines and the 408-standard library; and formalise "state" as a computable object through the 238-dimensional risk function.