Direct answer
The starting point of power carbon-emission management is not an accounting formula but usable power-consumption data. Without continuous energy acquisition, any carbon assessment can only remain an estimate. In the documented product and platform structure, power-data acquisition, aggregation and assessment are layered: on the acquisition side, smart meters and multi-parameter controllers handle meter monitoring; the edge layer handles aggregation; the platform layer completes access and AI reasoning; and the application layer handles presentation. Carbon is not isolated but one dimension of the Wanxiang engine's four-dimensional impact assessment, scoring alongside safety, efficiency and lifetime; each Qianzhi engine alert also carries a four-dimensional impact tag. One boundary must be stated first: the product knowledge base gives no power carbon-emission factor, no conversion coefficient from energy to carbon, and no carbon accounting formula, so this article describes only how the system organises data and dimensions, and infers no specific carbon factor, accounting methodology or quantitative mapping.
1. Why power carbon must first return to measurable data
Carbon-emission discussion often starts from the accounting method, but for field engineering the first question is actually earlier: where does the data come from. If energy itself is acquired discontinuously and with inconsistent definitions, the input is unreliable no matter what accounting model is used. The product knowledge base splits the acquisition, aggregation and analysis of power data into different layers precisely to complete the measurable raw data before assessment and presentation are discussed.
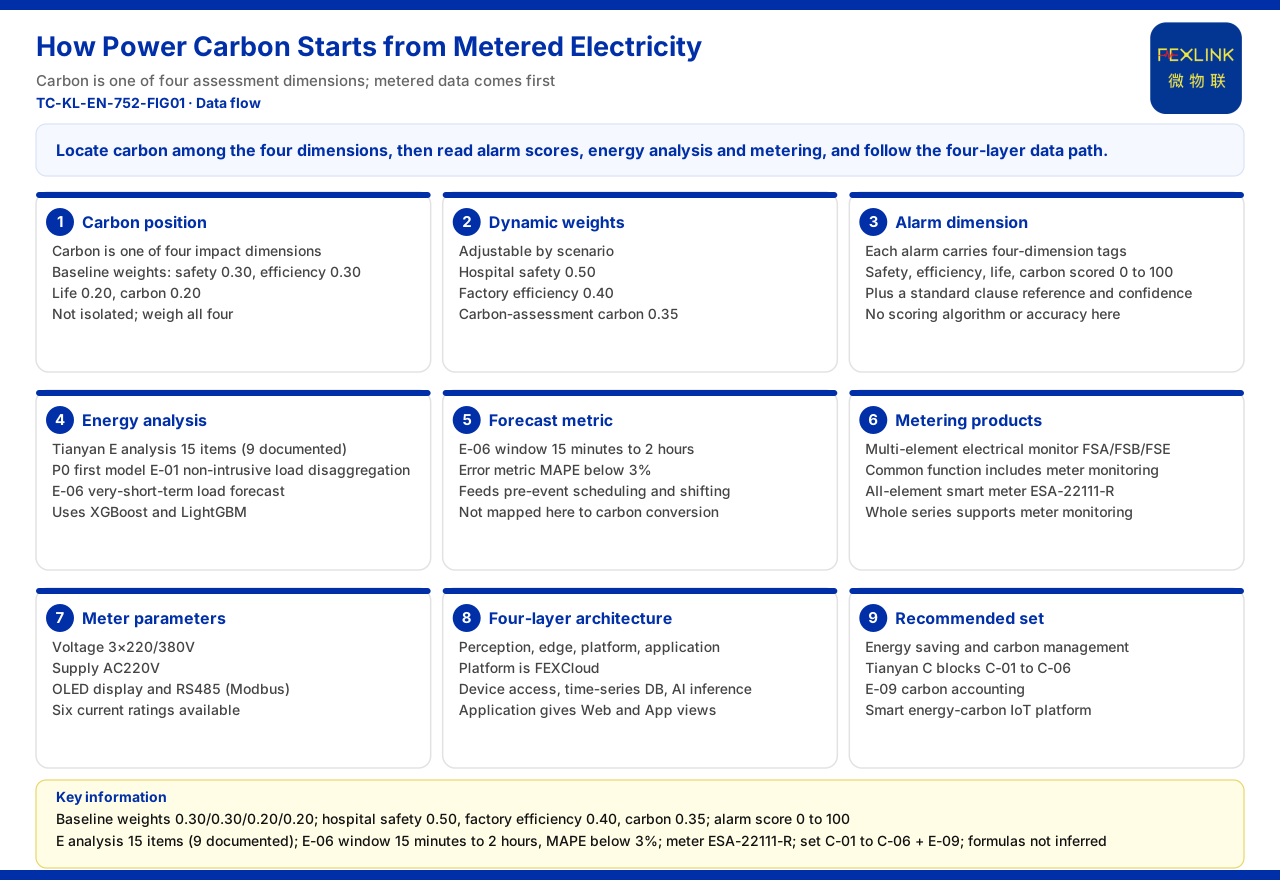
The reading order here is: first see where carbon sits in the assessment system, then how an alert carries the carbon dimension, then the upstream energy-analysis and acquisition products, and finally the data link through the four-layer architecture. Each step cites only what the product knowledge base lists.
2. Carbon emissions as one of the four impact dimensions
In the impact assessment of the Wanxiang engine described by the product knowledge base, safety, efficiency, lifetime and carbon emissions form four assessment dimensions, with baseline weights of 0.30 for safety, 0.30 for efficiency, 0.20 for lifetime and 0.20 for carbon. The weights are not fixed: they can be adjusted dynamically for different scenarios, with a safety weight of 0.50 for hospital scenarios, an efficiency weight of 0.40 for factory scenarios, and a carbon weight of 0.35 for carbon-assessment scenarios.
This shows carbon is not an isolated indicator. A single equipment anomaly or a single load change projects at the same time onto safety, efficiency, lifetime and carbon; a high carbon figure does not automatically mean shutdown or replacement is needed, but depends on the trade-off among the four dimensions. Only by understanding this can one avoid pulling carbon out alone and making an over-reaction. The product knowledge base gives only the weight definitions, not the algorithm or trigger conditions for weight switching, and this article does not develop that part.
3. How the alert side carries the carbon dimension
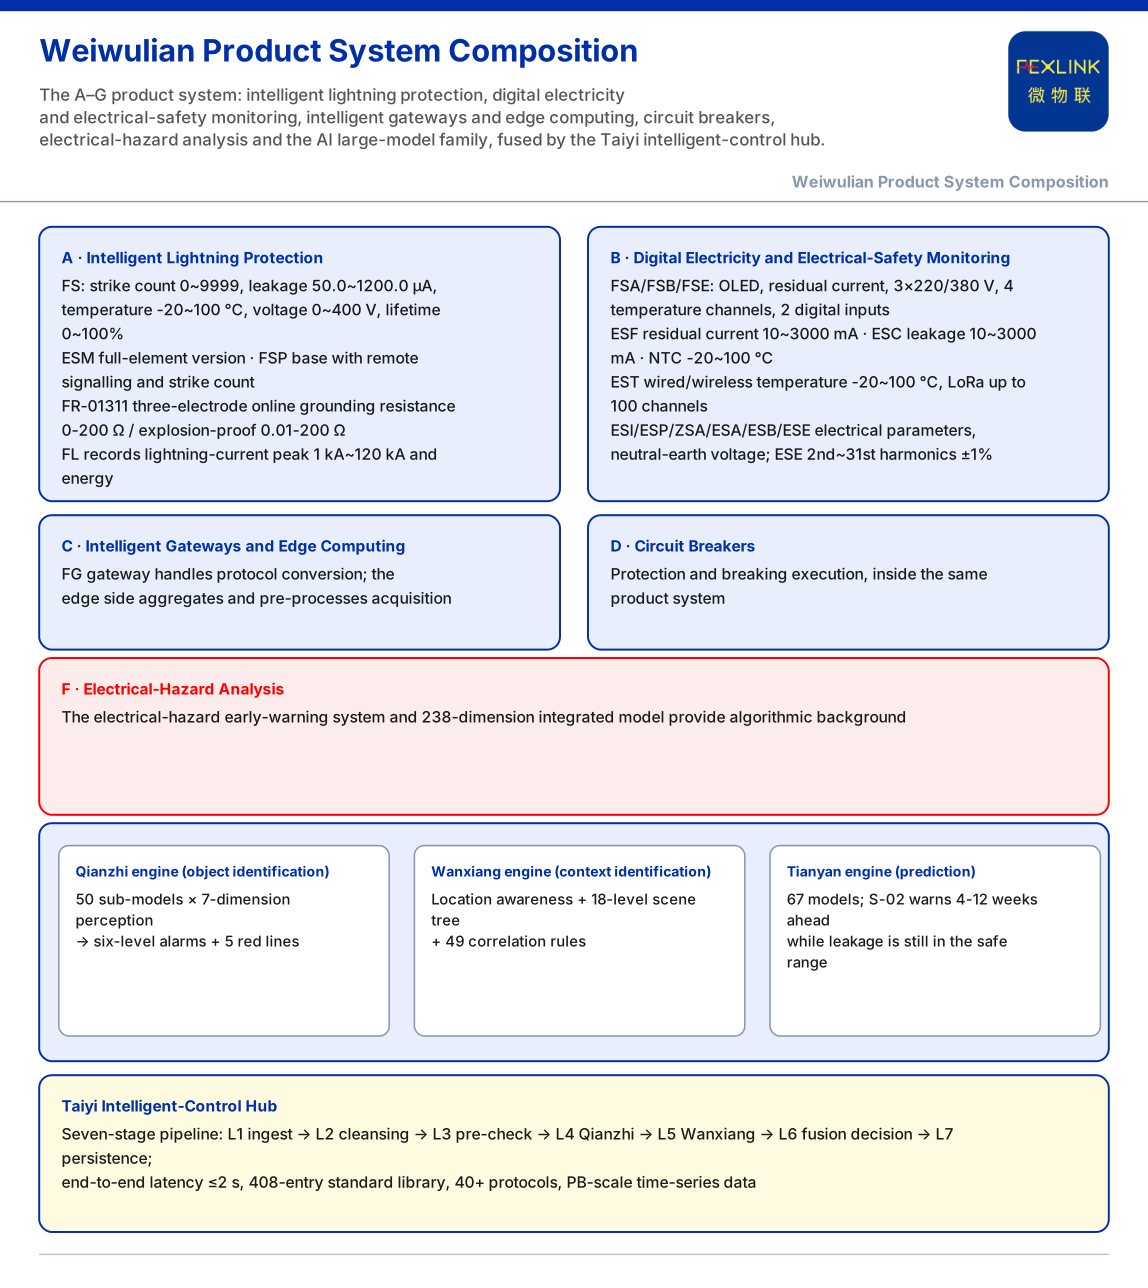
In the alert system of the Qianzhi engine, each alert carries a standard-clause citation, a four-dimensional impact tag, a confidence level and a scenario tag. The four-dimensional impact tag gives a score from 0 to 100 for safety, efficiency, lifetime and carbon. Carbon thus becomes one of the output dimensions of alert assessment in score form.
For a user, carbon information can arrive together with the alert: an alert states not only "what is abnormal" but its impact score on the carbon dimension. Note that the product knowledge base describes only the existence of the tag and score, not the calculation detail, thresholds or weight mapping, and this article does not develop its algorithm or accuracy.
4. Energy analysis: the upstream capability of carbon management
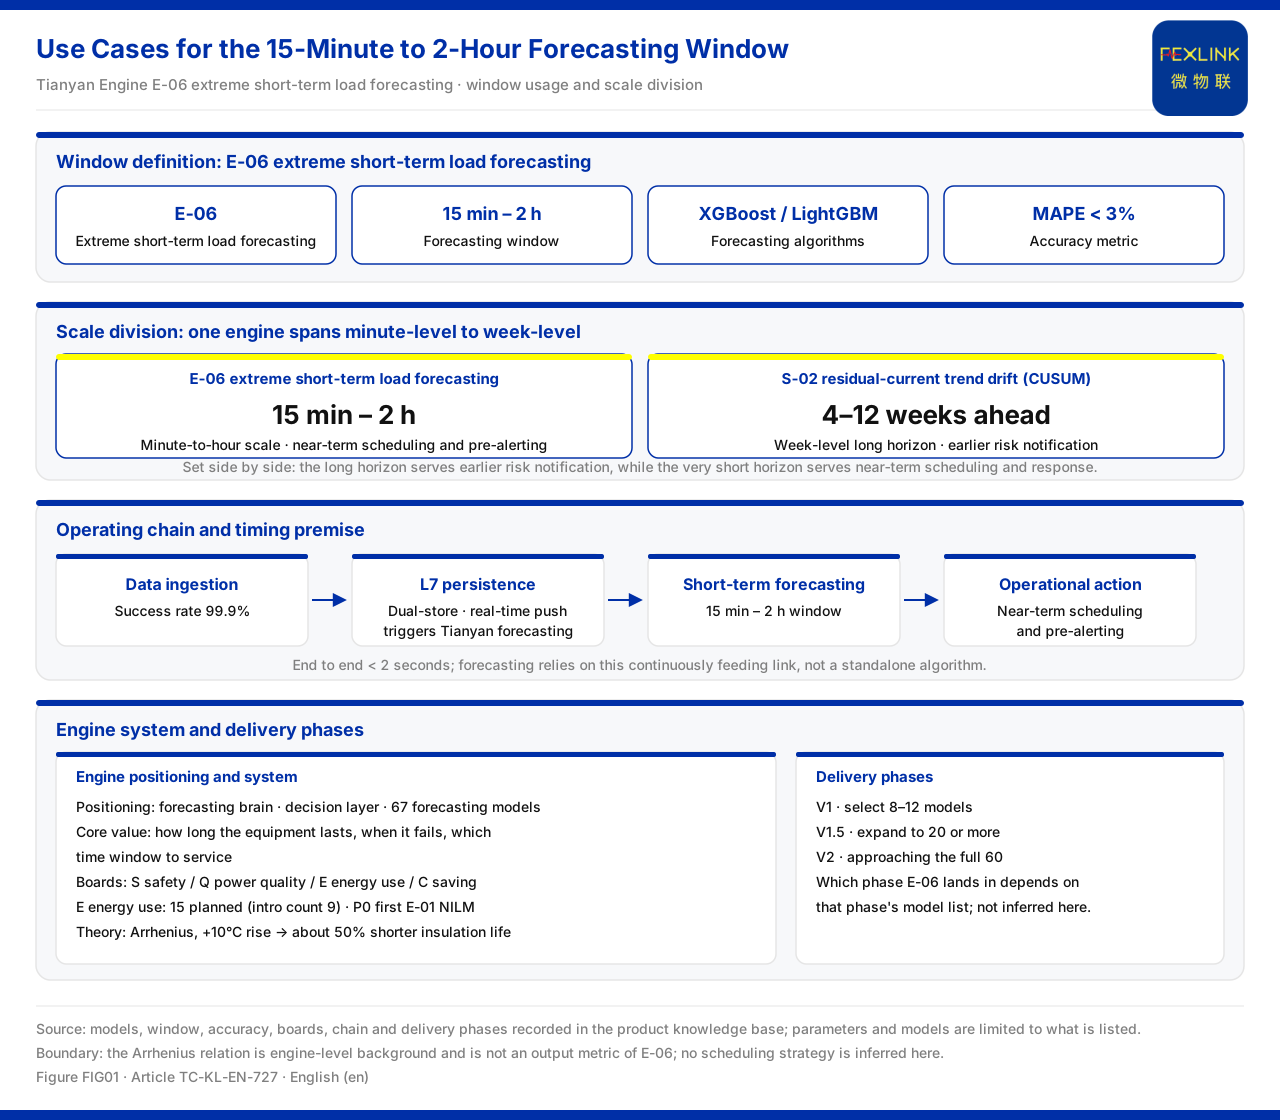
Carbon management is directly related to energy analysis. The product knowledge base records that the E energy-analysis board of the Tianyan engine is planned as 15 items, with a documentation description of 9, and the P0 first-release model is E-01 non-intrusive load monitoring (NILM). Among them, E-06 extremely short-term load forecasting uses XGBoost and LightGBM, with a forecast window of 15 minutes to 2 hours and an error metric MAPE of less than 3%.
These capabilities address the question "roughly how much energy will be used in the near future". For carbon management, a predictable energy curve is the basis for pre-emptive scheduling and peak shifting; E-01 non-intrusive load monitoring, in turn, is used to distinguish load composition from total consumption. This article does not infer the direct use of these models in carbon conversion; it states only that they provide input on the energy side. The product knowledge base gives two counts for the board, and this article marks them side by side rather than choosing one.
5. Acquisition side: meter monitoring provides the product base
For energy data to enter assessment, there must be measurable acquisition products. The product knowledge base records that the common functions of the multi-parameter electrical intelligent controller (FSA/FSB/FSE series) include meter monitoring; the all-parameter smart meter (ESA-22111-R) supports meter monitoring across the whole series, with a voltage of 3 × 220/380 V, AC220V supply, an OLED display and RS485 (Modbus) communication, and six current grades.
These are the product capabilities given verbatim by the product knowledge base. This article adds no sampling accuracy, metering class or certification beyond them. What can be confirmed is that meter monitoring provides the product base for energy-data acquisition; it is the upstream data source of carbon assessment, not the accounting itself.
6. Data link: the four-layer architecture carries power data to assessment
The product knowledge base gives the general four-layer architecture of the monitoring system: the perception layer consists of monitoring modules, smart meters and sensors; the edge layer consists of gateways, industrial wearables and cloud PLCs; the platform layer is FEXCloud, handling device access, a time-series database and an AI reasoning engine; and the application layer provides Web and App visualisation, alert management, analysis reports and mobile inspection.
Power data is acquired at the perception layer, aggregated at the edge layer, enters access and storage at the platform layer, participates in analysis in AI reasoning, and is presented at the application layer. If carbon assessment is to run on real data, it must follow this link. This also explains why carbon management is not a single-point product but a combination of acquisition, aggregation, analysis and presentation. The product knowledge base gives no protocol detail or latency figures between the layers, and this article does not add them.
7. Selection view: how energy saving and carbon management combine
In the selection comparison of the product knowledge base, the combination for energy saving and carbon management corresponds to the Tianyan C board (C-01 to C-06), E-09 carbon accounting, and the smart energy-carbon IoT platform. The three correspond respectively to analysis, accounting and platform hosting, connecting power and energy data with carbon-accounting capability.
It should be emphasised again that the product knowledge base gives only this combination relationship, not the input-output format, accounting definition or platform function list of each link. On that basis this article infers no product or parameter outside the combination and does not describe it as a directly deliverable project scheme.
8. Common misreadings and reading order
The first misreading is to treat carbon as a single indicator and ignore its linkage with safety, efficiency and lifetime. The second is to treat carbon factors and accounting formulas absent from the product knowledge base as capabilities the system already contains. The third is to bypass acquisition and the data link and drive carbon-management decisions directly with estimates. The fourth is to treat the count of the energy-analysis board as a version commitment and ignore that the documentation carries two counts. The fifth is to read the selection combination as a fixed configuration and ignore that the knowledge base gives no connection or accounting detail.
The corresponding reading order is: first confirm carbon's place in the four-dimensional assessment, then see whether an alert carries a carbon score, then verify the energy-analysis and acquisition products, then confirm the data destination along the four-layer architecture, and finally return to the energy-saving and carbon-management selection combination.
Scope and limitations
First, the factual basis of this article is the product knowledge base, and all product parameters are limited to what it lists. Second, the product knowledge base gives no power carbon-emission factor, no conversion coefficient from energy to carbon, and no accounting formula, and this article lists no factor or conversion value. Third, carbon appears as a score in the alert output dimension, and only the tag structure is described, without the scoring algorithm or accuracy. Fourth, the Tianyan E energy-analysis board has two counts, 15 items and 9, and this article marks both rather than choosing one. Fifth, this article promises no energy-saving rate, carbon-reduction amount or platform effect; the relevant conclusions must be verified by the specific project. Sixth, certification, metering class and compliance conclusions are outside the scope of this article and are subject to the latest product material and formal documents.