Direct answer
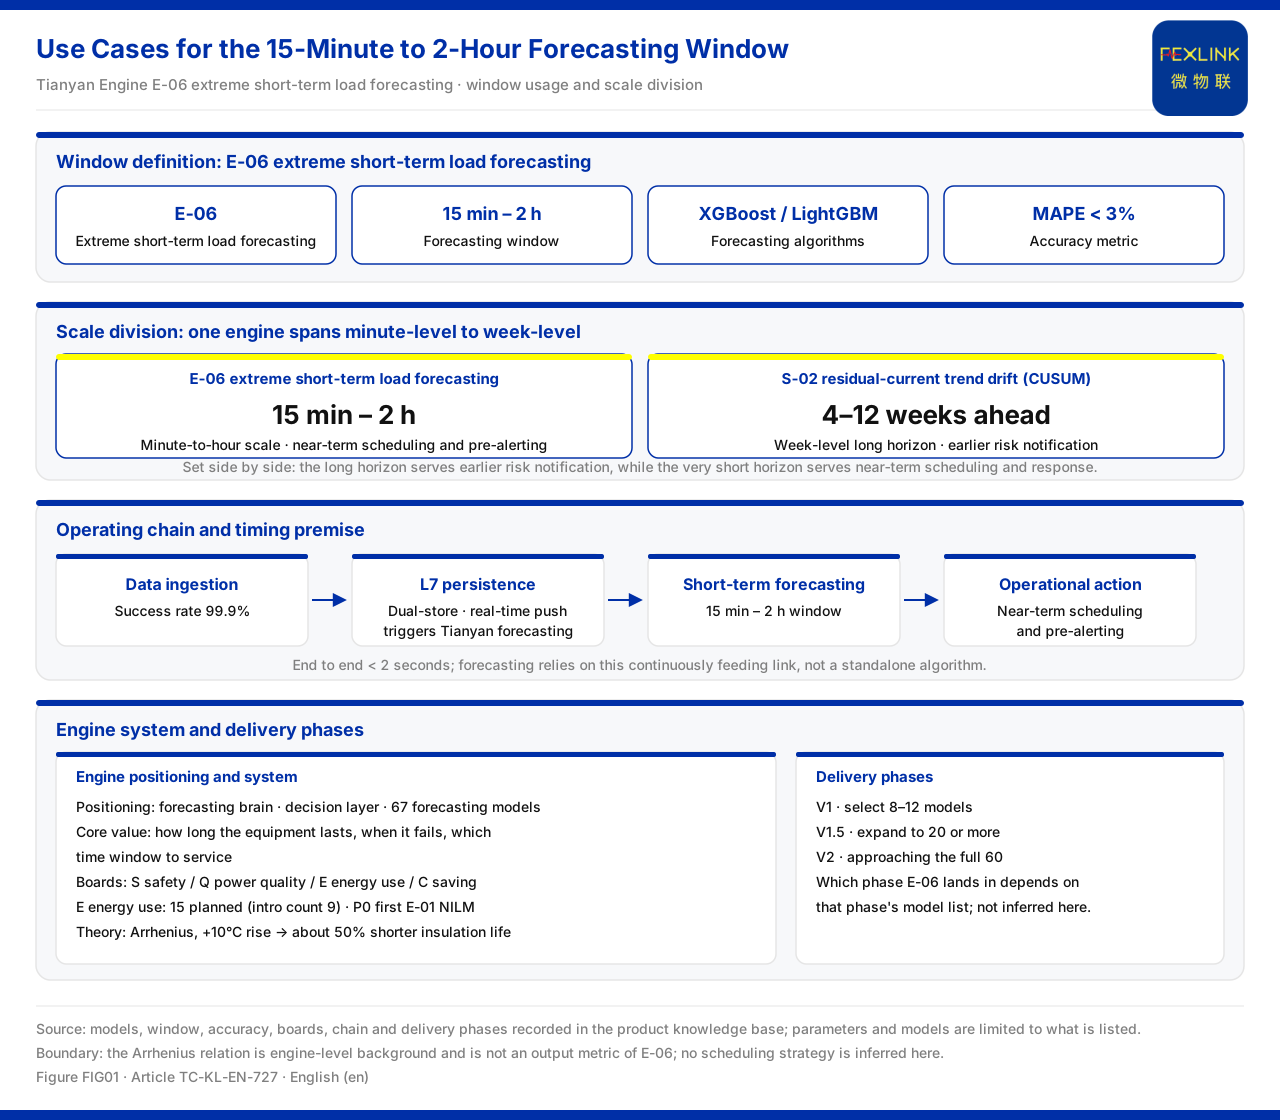
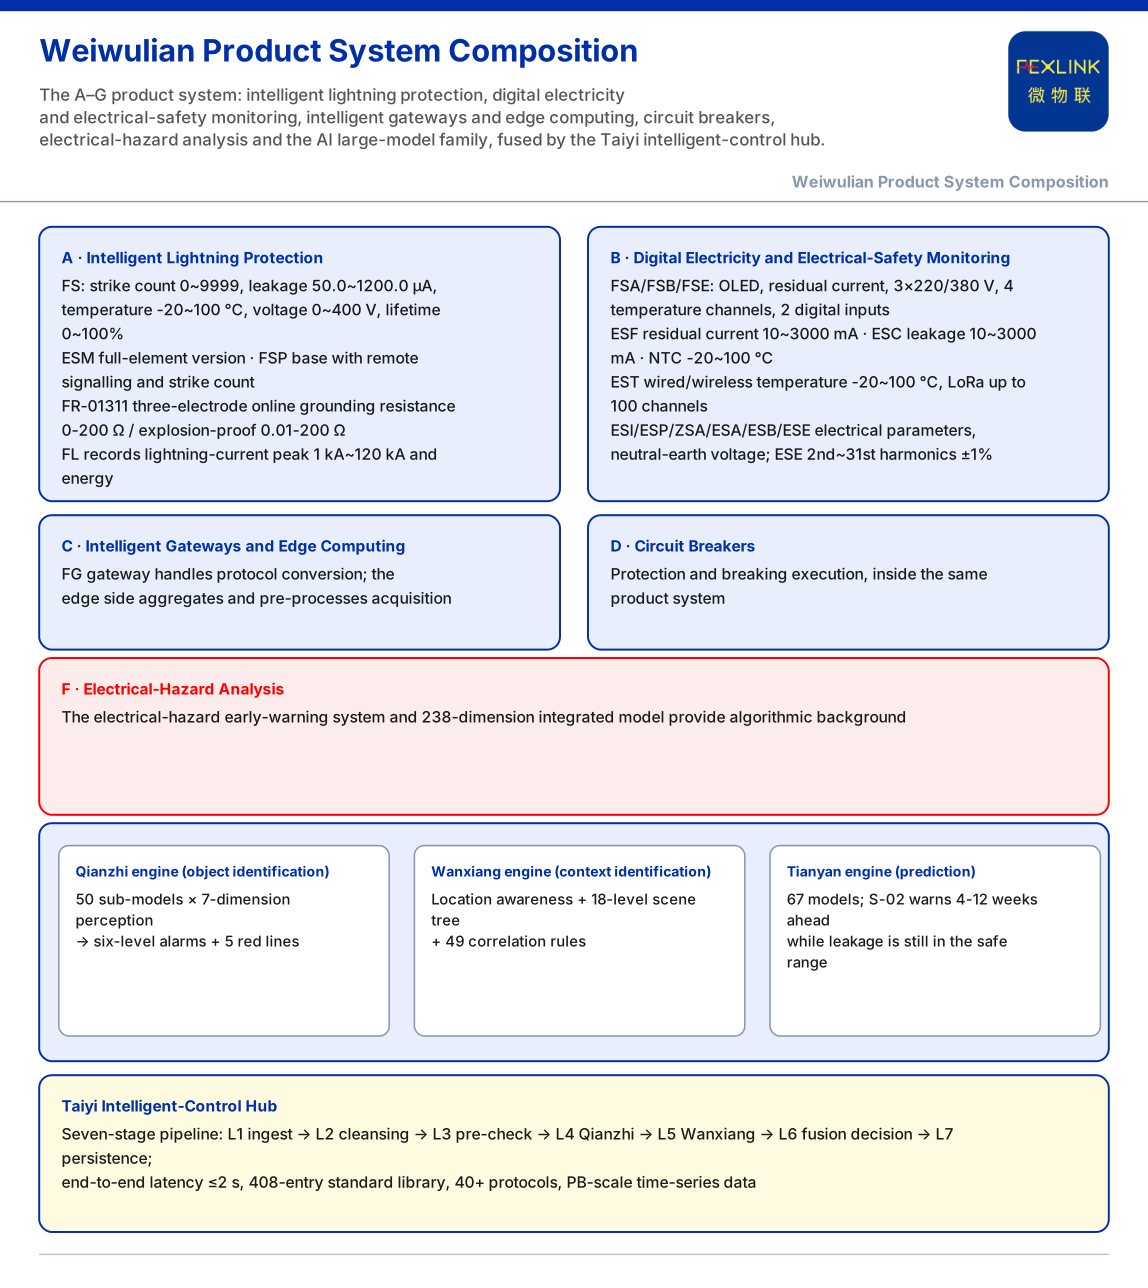
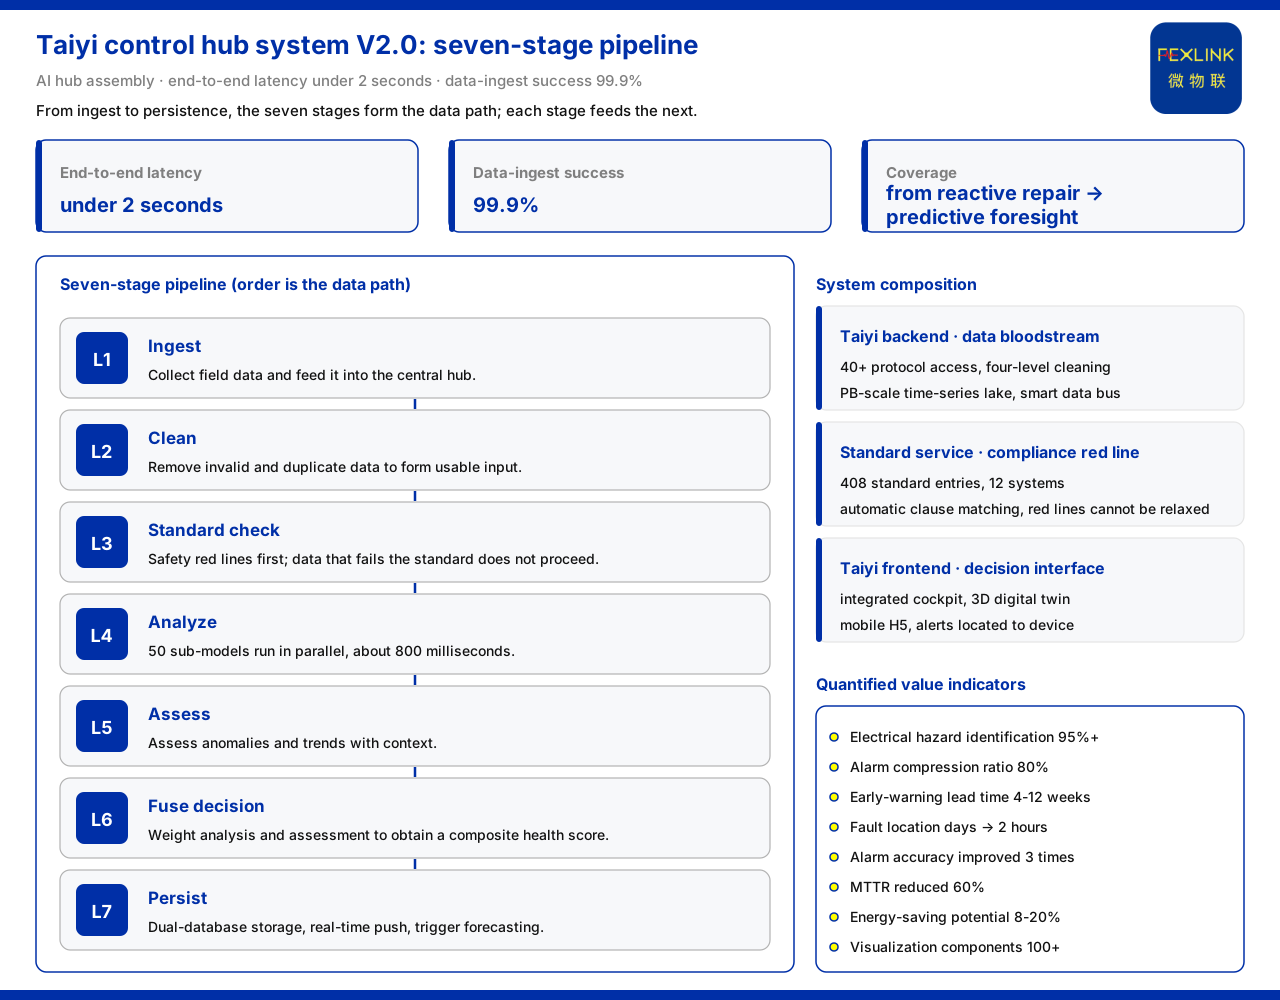
In the AI large-model family of the knowledge base, the Taiyi intelligent control hub system (Taiyi hub) is positioned as "AI hub assembly V2.0." According to the knowledge base, it uses a seven-stage pipeline, has an end-to-end latency below 2 seconds, achieves a data-ingestion success rate of 99.9%, and extends its coverage from "post-event emergency repair" to "pre-event prediction." It is not a single algorithm module but a complete hub that strings data ingestion, cleaning, standard validation, parallel analysis, assessment, fusion decision, and persistence into one chain; its system composition can be divided into three parts: the backend, the standard service, and the front end.
Positioning and one-line summary
The family overview in the knowledge base lists the Taiyi intelligent control hub system as the V2.0 row and states its positioning as "AI hub assembly V2.0." The quantitative figures that appear alongside it are an end-to-end latency below 2 seconds, a data-ingestion success rate of 99.9%, and coverage from "post-event emergency repair" to "pre-event prediction." All three are statements listed directly in the knowledge base, and this article does not extrapolate other performance conclusions.
The seven-stage pipeline
The seven stages listed in the knowledge base are: stage one, ingestion; stage two, cleaning; stage three, standard validation (with the safety red line placed up front); stage four, analysis (50 sub-models in parallel, about 800 milliseconds); stage five, assessment; stage six, fusion decision (weighting and combining the analysis and assessment results into an overall health score); stage seven, persistence (dual-database storage, real-time push, and triggering prediction). The significance of this chain is that data entering at the front passes in turn through cleaning, standard validation, parallel analysis, assessment, and fusion before it finally reaches storage and push. Each stage is the input to the next, and the sequence is the data-processing path.
Read as an engineering sequence, the pipeline separates "what can enter" from "what is concluded." Stages one and two address the quality of the incoming data; stage three places a non-negotiable standard gate ahead of analysis; stages four and five perform parallel computation and assessment; stages six and seven turn intermediate results into a weighted decision and a persisted record. The position of the orchestration stage inside the chain, rather than beside it, is what makes the hub a single pipeline instead of a set of loosely coupled modules. Stage boundaries are named as the knowledge base names them, and this article does not infer the internal implementation of any stage.
System component one: the backend
The knowledge base calls the Taiyi backend the "data bloodstream"; its responsibilities include access for more than 40 protocols, four-stage cleaning, a PB-scale time-series data lake, and an intelligent data bus. In other words, protocol access and cleaning are completed in the backend, the cleaned time-series data enters the data lake, and the data bus supplies it to the subsequent stages. What this layer solves is "data can get in, can be cleaned, and can be retrieved."
System component two: the standard service
The standard service is described as the "compliance red line" and contains a library of 408 standards covering 12 systems such as GB, GB-T, DL, IEC, and UL; it supports automatic clause matching, and the red line cannot be relaxed. Within the seven-stage pipeline it corresponds to stage three, standard validation: data passes the standard gate before it enters analysis. The knowledge base emphasizes that it "cannot be relaxed," indicating that this is a constraint in the process that cannot be skipped, not an optional reference item.
System component three: the front end
The Taiyi front end is positioned as the "decision interface" and includes an integrated dashboard, a 3D digital twin, and a mobile H5 client. The 3D digital twin can locate an alarm to a specific device, and the mobile H5 client is intended for viewing at any time. The front end takes over the presentation and decision-making that follow stage-seven persistence.
Quantified value indicators
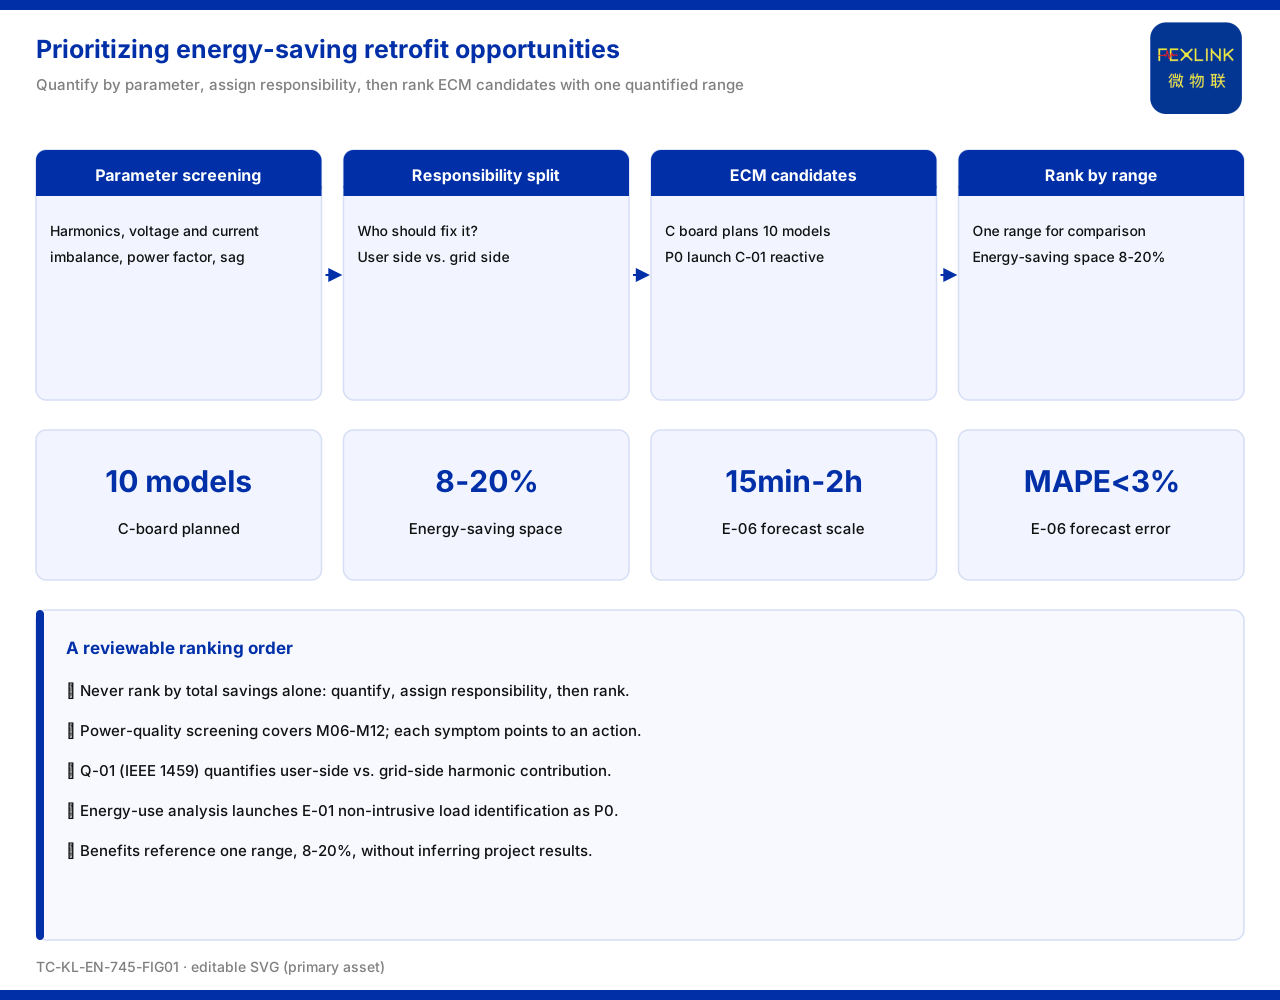
The quantified value indicators listed in the knowledge base include: an electrical-hazard identification rate of 95% or more, an alarm compression ratio of 80%, a warning lead time of 4 to 12 weeks, fault-location time shortened from several days to 2 hours, alarm accuracy improved by a factor of 3, mean time to repair (MTTR) reduced by 60%, a comprehensive energy-saving potential of 8% to 20%, and more than 100 visualization components. These figures are limited to the wording listed in the knowledge base, and this article does not read them as a commitment for any given site.
Applicable industries and engineering implementation
The applicable industries listed in the knowledge base include automotive manufacturing, data centers, semiconductors, commercial buildings, industrial parks, medical institutions, and new-energy stations. On the engineering side, the knowledge base states that it uses FastAPI, PostgreSQL, and TDengine, combined with a time-series data lake, and includes the related engine code together with a 2.0 test-acceptance system. Both the industries and the implementation are listed as written in the knowledge base.
The industry list matters to solution engineers because it maps the hub to site profiles that already generate large volumes of continuous electrical and operational data. On the implementation side, the stack named in the knowledge base places an API layer, a relational database, and a time-series database alongside the time-series data lake, so the pipeline's ingestion, storage, and analysis responsibilities have corresponding components. The 2.0 test-acceptance system is listed as part of the implementation, while the detailed acceptance scope is not expanded in the knowledge base and is therefore not extended here.
Scope and limitations
- The content of this article is limited to the existing statements in the product knowledge base on the positioning, seven-stage pipeline, system composition, quantified value indicators, applicable industries, and engineering implementation of the Taiyi intelligent control hub system V2.0. It does not extend to algorithm details, model-count details, or deployment conclusions not listed in the knowledge base. - The quantified indicators in this article (end-to-end latency, data-ingestion success rate, identification rate, compression ratio, lead time, location time, accuracy multiple, MTTR reduction, energy-saving potential, and visualization-component count) are all figures listed in the knowledge base and do not constitute a commitment regarding the results of a specific project. - The names of the seven pipeline stages are cited as written in the knowledge base; this article does not infer further details of the internal implementation of each stage. - The 408-standard library and the 12 systems listed for the standard service are the knowledge base's own figures, and this article does not present them as a determination of compliance for any product. - This article constitutes no commitment regarding any unlisted indicator; actual capability is subject to the latest product documentation and the project solution.