Direct Answer
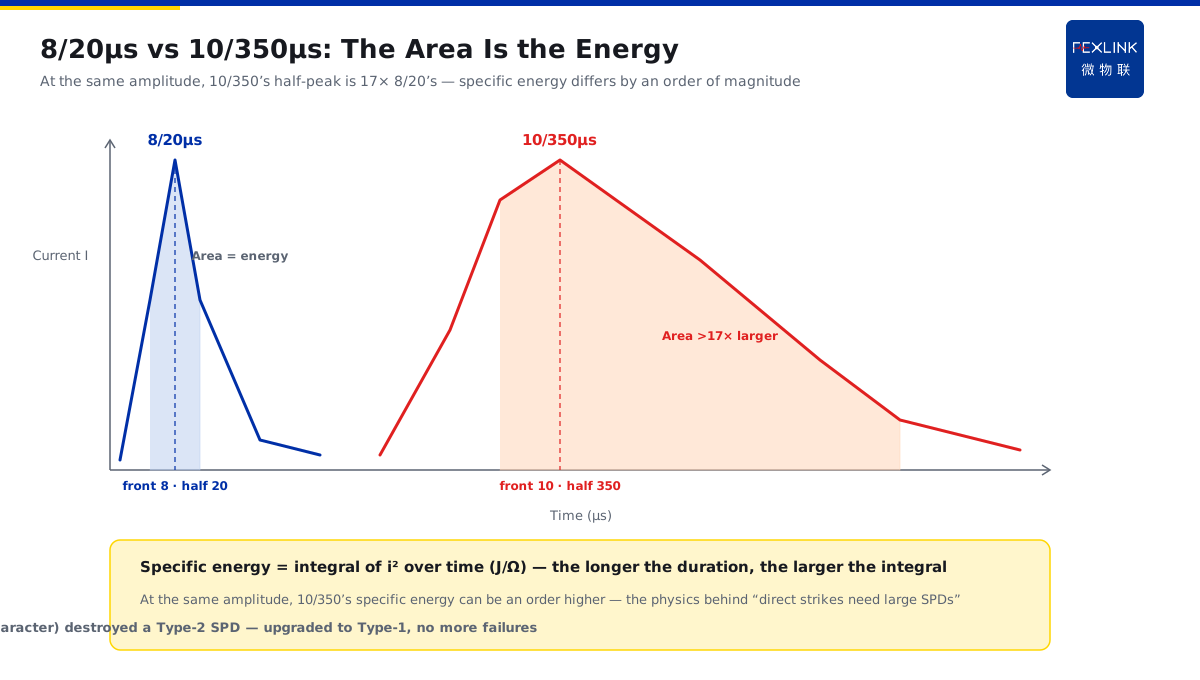
On drawings, a Type-1 SPD is marked 10/350 μs and a Type-2 SPD 8/20 μs — what do these two sets of times differ in, and why do they decide whether the SPD can survive? The answer: 8/20 μs is the typical waveform of induction surges (8 μs front, 20 μs to half-peak; concentrated energy, short duration), while 10/350 μs simulates the large charge and long continuing component of a direct strike (350 μs to half-peak) — their specific energy differs by an order of magnitude. Choosing a waveform is not a test preference: it decides whether the SPD must be a switch-type device discharging direct-strike energy or a voltage-limiting device clamping induction surges.
A factory entrance originally used a Type-2 SPD tested with 8/20 μs, fine for "induction surges". After adding direct-strike protection to the roof and shortening the current path into earth, the SPD kept failing. Investigation showed the direct-strike component (characterized by 10/350 μs) carried charge beyond the Type-2's capacity — it should be upgraded to a Type-1 discharge stage (10/350 μs test). The key point: 8/20 μs guards "induction surges"; 10/350 μs guards "direct-strike charge" — the direct-strike channel must use a 10/350-class high-energy SPD.
Why:
- Waveform parameters: 10 and 8 are the front times (μs); 350 and 20 are the half-peak times (μs); - 8/20 μs: typical of induction/operation surges, medium amplitude, short duration; - 10/350 μs: large direct-strike charge and long continuing component, specific energy (Joule integral per unit resistance) an order of magnitude higher; - Selection mapping: direct-strike zones at the service entrance use T1 (10/350); sub-distribution/equipment ends use T2 (8/20).
Key insight: "The waveform is not a cold test-spec parameter — 10/350 vs 8/20 stands for two different lightning energies and directly decides the SPD category and installation position."
A park's distribution room once installed a Type-2 SPD at the service-entrance board (which should have been Type-1); it failed twice in one thunderstorm season. Checking the spec showed the SPD was tested with 8/20 μs and could not handle the direct component at the entrance. After replacing the entrance SPD with a Type-1 (Iimp 12.5 kA, 10/350 μs) and keeping Type-2 at the equipment end, no further failures. Lesson: the waveform decides the SPD's "working boundary" — SPDs on the direct-strike path must be selected by 10/350 μs.
1. How to Read Waveform Parameters: Front Time and Half-Peak Time
Step one: what the notation 10/350 μs means.
Waveform notation: - The first number is the front time T1 (time for the current to rise from zero to peak); - The second is the half-peak time T2 (time from zero to falling back to half-peak); - Both are in microseconds (μs); - E.g., 8/20 μs: 8 μs front, 20 μs half-peak.
Why it matters: - The front time decides the current rise rate (di/dt); - The half-peak time decides the duration (the energy carrier); - Together they decide the "specific energy" (integral of current squared over time); - Different waveforms mean fundamentally different stress on the SPD.
Intuitive understanding: - 8/20 μs is like "a short punch" — it comes fast and goes fast; - 10/350 μs is like "a sustained press" — a little slower to rise, lasts much longer; - A half-peak of 350 μs is more than 17× that of 20 μs; - At the same amplitude, longer duration means far more energy.
Key insight: "The front time shows the rise rate, the half-peak time shows the duration — '8/20' and '10/350' differ in the energy carrier, not in a few microseconds."
2. 8/20 μs Corresponds to Induction Surges
Step two: what a Type-2 SPD faces.
Induction-surge characteristics: - Lightning strikes far away; electromagnetic induction creates surges on the line; - The waveform is relatively smooth and medium in amplitude; - The typical waveform is 8/20 μs; - No large direct-strike charge.
Properties of 8/20 μs: - 8 μs front, 20 μs half-peak; - Short duration, relatively concentrated energy; - The peak (e.g., In = 20/40 kA) is the nominal discharge current; - Suited to voltage-limiting SPD clamping.
Applicable positions: - Sub-distribution and end equipment (Type-2); - SPDs near equipment (T2 test per IEC 61643-11); - Clamp the residual and protect the equipment port; - Coordinate with T1 as the second-stage clamp.
Key insight: "8/20 μs is the 'standard portrait' of induction surges — Type-2 SPDs are tested with it; they clamp at sub-distribution and equipment ends."
3. 10/350 μs Corresponds to the Large Charge of a Direct Strike
Step three: what a Type-1 SPD faces.
Direct-strike characteristics: - Lightning strikes the building/line or nearby ground directly; - Large charge flows into the earth along the channel; - The waveform contains a long continuing component; - It must be discharged by the SPD at the service entrance.
Properties of 10/350 μs: - 10 μs front, 350 μs half-peak; - Long duration, large charge; - High specific energy (corresponding to the Iimp test); - Requires a switch-type/discharge-type SPD.
Applicable positions: - Service entrance and main distribution (Type-1); - The entrance of the direct-strike protection zone (LPZ0 into LPZ1); - The Iimp (10/350 μs) parameter is the key; - Discharge the large energy and protect downstream.
Key insight: "10/350 μs is the 'large-charge portrait' of direct strikes — Type-1 SPDs are tested with it and installed at the entrance to discharge direct energy."
4. Why the Specific Energy Differs by an Order of Magnitude
Step four: how the waveform difference becomes an energy difference.
Definition of specific energy: - The integral of the squared current per unit resistance (Joule/Ω); - The longer the duration, the larger the integral; - The half-peak time of 10/350 μs is far longer than that of 8/20 μs; - At the same amplitude, the specific energy can differ by an order of magnitude.
Intuitive comparison: - At the same amplitude, 10/350 lasts more than 17× as long as 8/20; - Energy is directly related to duration; - Large charge (coulombs) is the core characteristic of direct strikes; - This is the physical reason "direct strikes need large-capacity SPDs".
Impact on selection: - Type-1 SPDs are rated by Iimp (10/350 μs); - Type-2 SPDs are rated by In (8/20 μs); - They are not interchangeable (different stress); - Mixing/misusing them → premature failure.
Key insight: "An order of magnitude in specific energy = an order of magnitude more 'work' for the direct-strike SPD — categories cannot be mixed, positions cannot be confused."
5. How Waveform Classification Maps to SPD Category and Position
Step five: putting selection into practice.
Mapping: - Direct-strike zone (service entrance/main distribution) → Type-1 (10/350 μs, Iimp); - Induction zone (sub-distribution/equipment end) → Type-2 (8/20 μs, In); - Inter-stage coordination: T1 discharges + T2 clamps; - Special environments (explosion hazards) assessed separately per code.
Design points: - Select the entrance SPD primarily by Iimp (10/350 μs); - Select the equipment-end SPD by In (8/20 μs) plus the voltage protection level; - Combine with the energy coordination in KD-0169: distance/capacity/leads; - Record the actual waveform (FL) to verify the design assumptions.
Product implementation: - FSS Intelligent Surge Protective Device: configured by T1/T2 staging; - FL Lightning-Current Monitor: records actual strike waveforms; - The platform correlates waveforms with SPD state; - Direct/induction classification statistics guide selection optimization.
Key insight: "Waveform → category → position: 10/350 discharges at the entrance, 8/20 clamps at the end — select by waveform, not by habit."
6. Common Misjudgments
1. Treating the waveform as a "test spec": not caring about the physics. Result: wrong category, wrong position. Correct: understand the energy difference behind the waveform. 2. Using Type-2 on the direct-strike path: installing an 8/20 μs SPD at the entrance. Result: cannot take the direct charge, fails repeatedly. Correct: use Type-1 (10/350) at the entrance. 3. Recognizing only the peak, not the energy: looking at kA without the waveform. Result: same kA, an order of magnitude different stress. Correct: select by waveform category. 4. Mixing T1/T2: category and position mismatched. Result: insufficient discharge or failed clamping. Correct: T1 at the entrance + T2 at the end, coordinated. 5. No verification after selection: not recording the actual waveform. Result: design assumptions unverified. Correct: compare FL-measured waveforms with the design.
Scope and Limitations
This article explains the parameter meaning, physical difference, and mapping of the two standard test waveforms 10/350 μs and 8/20 μs to SPD categories (T1/T2) and installation positions, applicable to SPD selection and lightning-protection design. The specific selection parameters (Iimp, In, voltage protection level, energy coordination) must follow IEC 61643-11, GB/T 18802.11, combined with the expected system lightning current and equipment withstand, completed by professional design. All cases are anonymized (a factory, a park's distribution room) and do not refer to any specific customer.