Direct answer
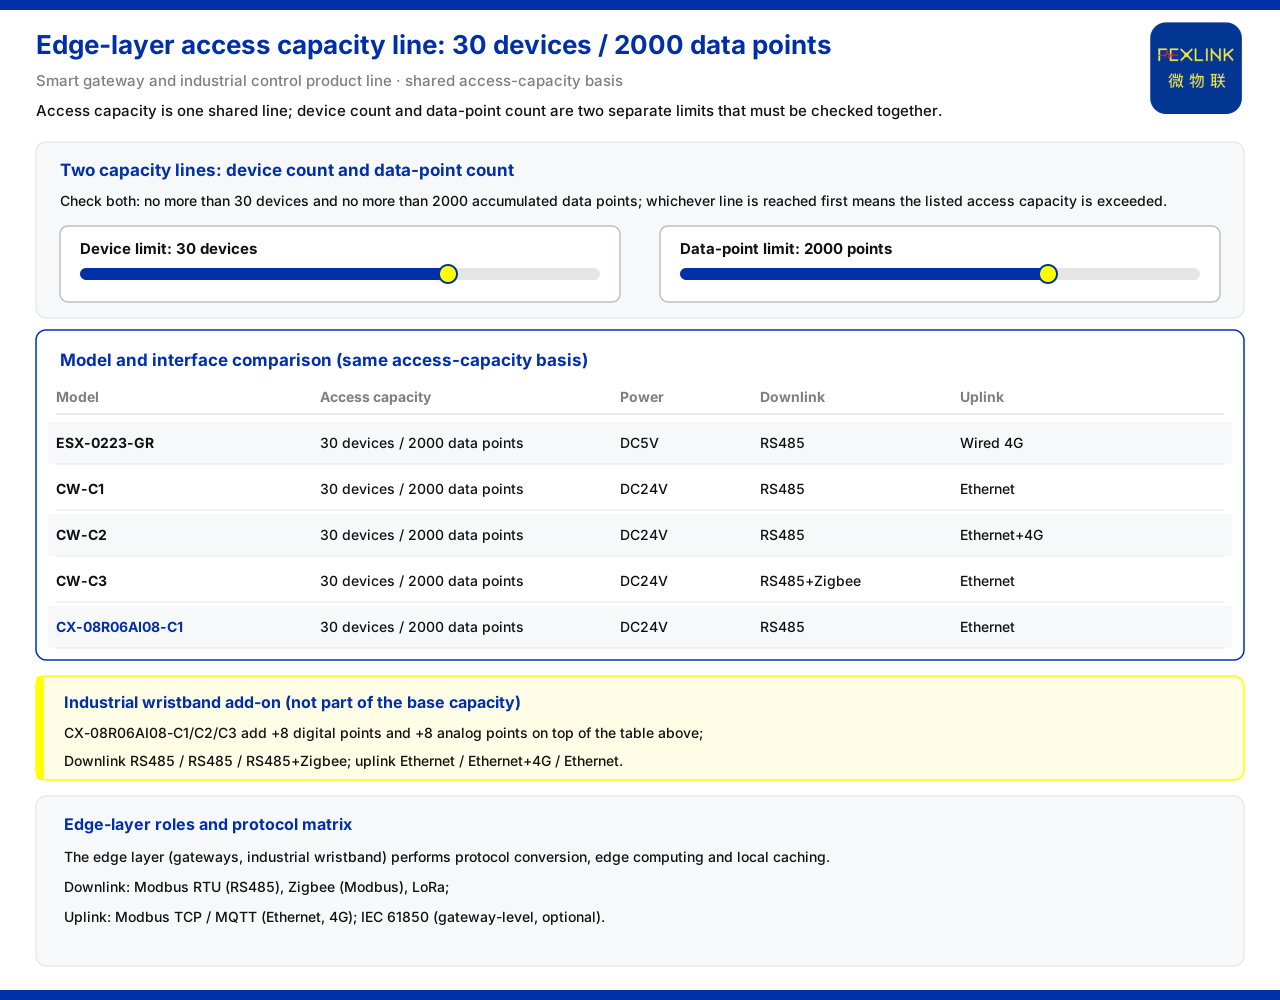
The knowledge base treats the access capability of the ESX intelligent edge-computing gateway (ESX-0223-GR), the CW industrial gateway (CW-C1, CW-C2, CW-C3), and the CX industrial wearable controller (for example CX-08R06AI08-C1) as one and the same line: 30 devices and 2,000 data points. For on-site point planning, the key to this line is not which number, 30 or 2,000, is larger, but the fact that it supplies two measuring sticks at the same time. Counting devices alone cannot tell whether a single gateway is sufficient, because the same 30 devices may correspond to widely different totals of data points. On-site verification should therefore check both items together: the number of connected devices must not exceed 30, and the accumulated total number of data points must not exceed 2,000. Whichever limit is reached first shows that this set of points has exceeded the access capability listed in that model's parameter table.
The capacity line given by the parameter tables
In the parameter tables for the intelligent gateway and industrial control product lines in the knowledge base, the relevant models state access capability identically, and the differences fall in power supply and communication:
| Model | Access capability | Power supply | Downlink | Uplink | |:--|:--|:--|:--|:--| | ESX-0223-GR | 30 devices / 2,000 data points | DC5V | RS485 | Wired 4G | | CW-C1 | 30 devices / 2,000 data points | DC24V | RS485 | Ethernet | | CW-C2 | 30 devices / 2,000 data points | DC24V | RS485 | Ethernet + 4G | | CW-C3 | 30 devices / 2,000 data points | DC24V | RS485 + Zigbee | Ethernet | | CX-08R06AI08-C1/C2/C3 | 30 devices / 2,000 data points, plus +8 digital inputs and +8 analog inputs | DC24V | RS485 / RS485 / RS485 + Zigbee | Ethernet / Ethernet + 4G / Ethernet |
This table shows that access capability is not a differentiator among these models; it is a shared capacity line. What distinguishes the models during selection is power supply and network, while what determines whether capacity is sufficient during point verification is always this one capacity line.
Device count and data-point count are two different lines
The two numbers must be checked together because each can reach its ceiling first in different situations. Dividing 2,000 data points evenly across 30 devices gives roughly 67 points per device on average. If a single field device carries many measurement points, the device count may still be far below 30 while the total data points fills the 2,000 limit first. Conversely, if each device has very few points, the total may still have margin below 2,000 while the device count reaches 30 first. Both cases point to the same conclusion: watching only one of the two numbers can lead to the wrong judgment that "this gateway is still sufficient." The parameter table does not specify how many data points may be allocated per device, and this article does not supply that figure.
The industrial wearable must be read separately
For the industrial wearable (programmable device wearable) row, the wording is that it adds "+8 digital inputs and +8 analog inputs" on top of the 30 devices / 2,000 data points. It therefore cannot be simplified to exactly the same capacity as the gateways, nor should only the first half of the sentence be remembered. When verifying points, the parameter table should be read as written: the base part is likewise 30 devices and 2,000 data points, and the additional digital and analog inputs are extra items listed separately within the same row. They should not be applied interchangeably with the interface figures of other models.
Why this capacity line sits at the edge layer
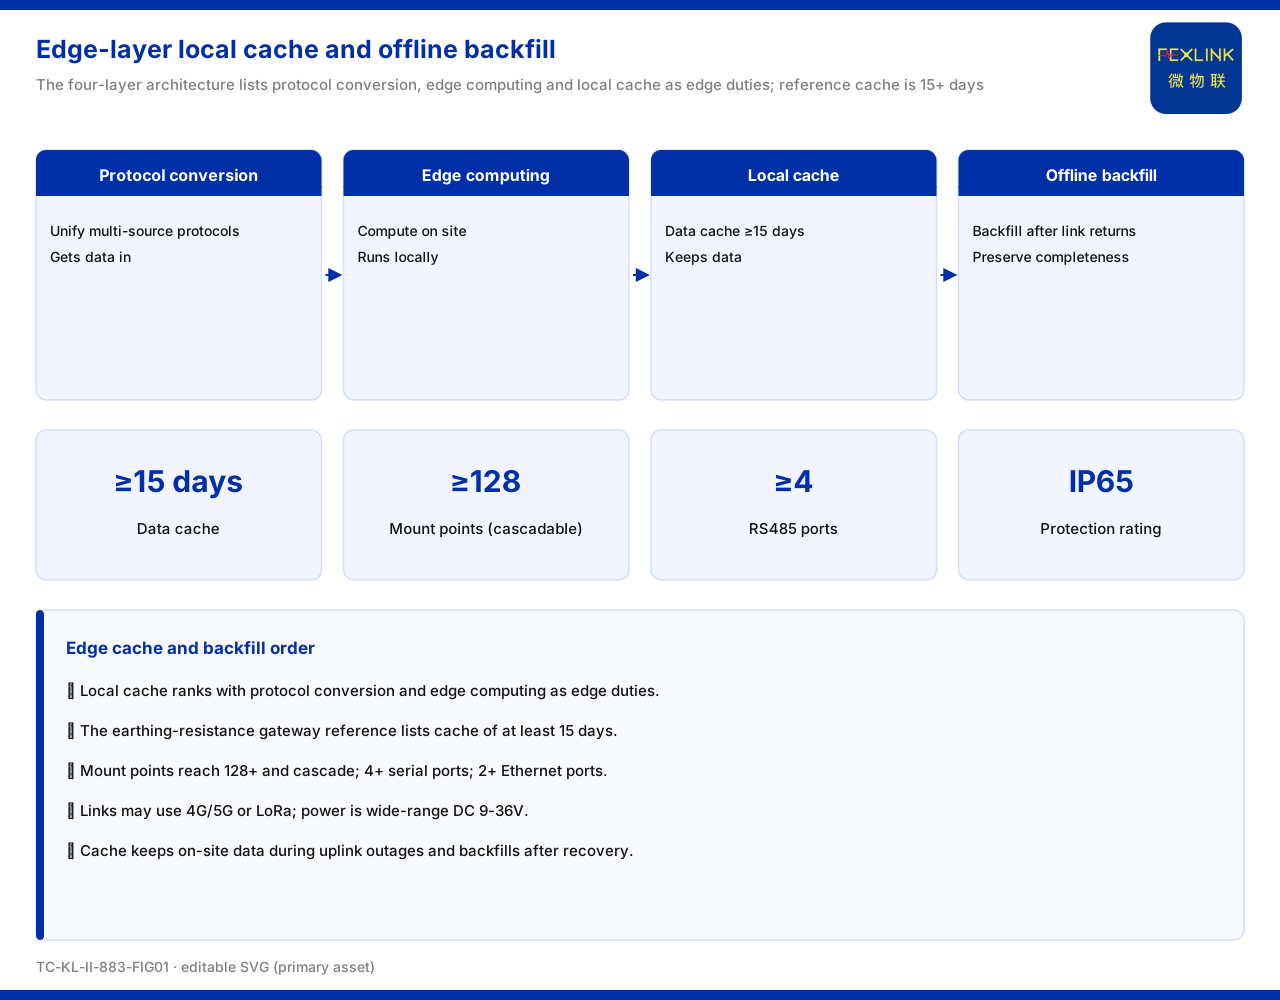
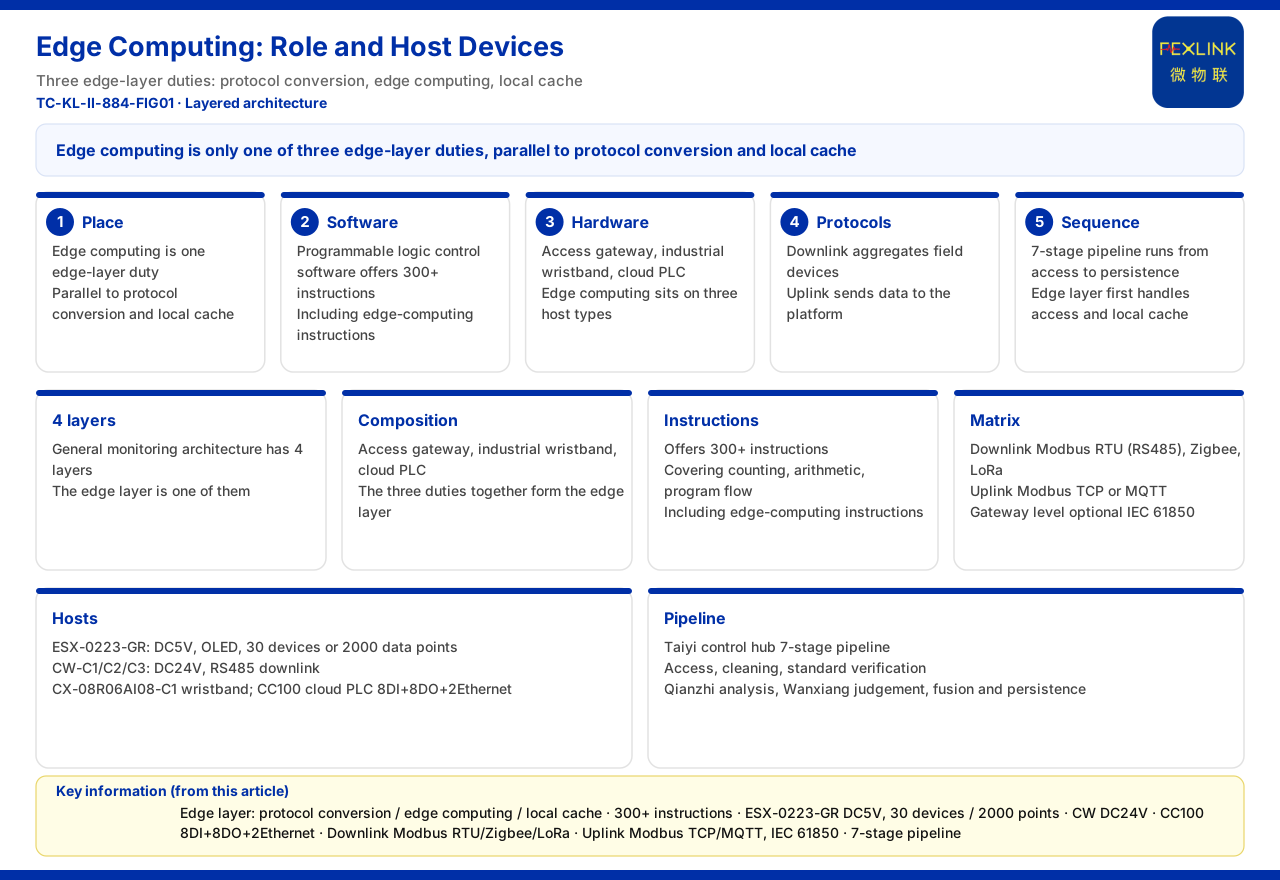
According to the general four-layer architecture of a monitoring system given in the knowledge base, the intelligent edge-computing gateway, the industrial gateway, the industrial wearable, and the lightning-protection smart gateway all belong to the edge layer, and together they carry three responsibilities: protocol conversion, edge computing, and local caching. The capacity line appears at this layer, which means it is an aggregation constraint on the field side: however many devices and measurement points the site has to aggregate here, that is where they must be checked against this line. The capability figures at the platform layer and the application layer differ from this one and cannot be substituted for edge-layer capacity verification.
Downlink and uplink interface correspondence
The communication protocol matrix in the knowledge base provides the protocol entries corresponding to the interfaces in the table above. The device downlink direction lists Modbus RTU (based on RS485), Zigbee (Modbus), and LoRa; the device uplink direction lists Modbus TCP / MQTT, which can run over Ethernet and 4G, and also lists IEC 61850, which is an optional gateway-level capability. The RS485, Ethernet, and wired 4G in the parameter table correspond to exactly this group of matrix entries. Point verification therefore looks not only at quantity but also at which downlink interface each measurement point falls on.
Common misreadings
The first is to read access capability only as device count and ignore the data-point total as a separate line. The second is the reverse: to count only data points and ignore device count. The third is to fold the extension quantities at the end of the industrial wearable row into the base capacity, or to mix its interfaces with those of other models. The fourth is to confuse the capacity figures of the edge layer with the capability figures of the platform and application layers. Keeping these four categories separate is what allows point planning to move from "estimating by experience" back to "checking item by item against the parameter table."
Scope and limitations
- This article restates only the access capability and interface figures listed in the knowledge base: the relevant models are 30 devices and 2,000 data points, and the industrial wearable row adds +8 digital inputs and +8 analog inputs. Power supply and communication are limited to what the table above states; no throughput, concurrency, storage, or field-load indicators beyond the parameter table are extended. - The conclusion that device count and data-point count must be verified together follows from the fact that the parameter table lists both. The parameter table does not stipulate a per-device data-point allocation, a margin ratio, or how overruns are handled, and this article adds no such stipulation. - Scenario attribution is limited to the models listed in the knowledge base parameter tables; no substitution or compatibility relationships are inferred across product lines. - Communication protocol names are listed as written in the knowledge base protocol matrix, where IEC 61850 is optional at the gateway level; which item a given project adopts is subject to engineering configuration. - This article constitutes no commitment regarding any unlisted indicator; where site conditions differ from the premises above, the latest product documentation and the actual engineering solution prevail.